Demonstration of added utility depending on time to IVT and MT
Contents
Demonstration of added utility depending on time to IVT and MT#
In this notebook we examine the relationship between time to treatment and the effect of treatment.
Outcome results are calculated for three patients groups:
nLVO receiving IVT
LVO receiving IVT only
LVO receiving MT (data based on trails where 85% had also received IVT)
When we look at combined effect of these groups, we make some basic assumptions (which are used as being ‘reasonable’ rather than ‘definitive’):
20% of all ischaemic stroke admissions receive IVT and/or MT.
35% of our treated population have LVO.
28.6% of LVO receive MT (this gives 10% of all ischaemic strokes receiving MT)
85% of LVO receiving MT have received IVT (from clinical trials data); for those 85% if the benefit of IVT exceed the benefit of MT (e.g. very early IVT, and very late MT), then the benefit is based on IVT.
15.5% nLVO receive thrombolysis (this brings total IVT to 20% use).
Load packages#
import matplotlib.pyplot as plt
from matplotlib import cm
import numpy as np
import pandas as pd
from outcome_utilities.clinical_outcome import Clinical_outcome

import warnings
warnings.filterwarnings("ignore")
Load mRS distributions#
mrs_dists = pd.read_csv(
    './outcome_utilities/mrs_dist_probs_cumsum.csv', index_col='Stroke type')
Define plotting function#
def plot_results(results, time_to_ivt, time_to_mt,
                 title=' ', filename='test',
                 aspect='auto', figsize=(6,5)):

    time_step_ivt = time_to_ivt[1] - time_to_ivt[0]
    time_step_mt  = time_to_mt[1]  - time_to_mt[0]
    extent = [time_to_ivt[0]  - time_step_ivt*0.5,
              time_to_ivt[-1] + time_step_ivt*0.5,
              time_to_mt[0]   - time_step_mt *0.5,
              time_to_mt[-1]  + time_step_mt *0.5]

    fig = plt.figure(figsize=figsize)
    ax = fig.add_subplot()

    img1 = ax.contour(results,
                colors='k',
                linewidths=0.5,
                vmin=0,
                extent=extent,
                aspect=aspect)

    ax.clabel(img1, inline=True, fontsize=10)

    img2 = ax.imshow(results, interpolation='nearest', origin='lower',
                cmap=cm.gnuplot,
                vmin=0,
                extent=extent,
                aspect=aspect)


    ax.set_xlabel('Time to IVT (mins) if applicable')
    ax.set_ylabel('Time to MT (mins) if applicable')
    ax.set_xticks(np.arange(0, max_time_to_ivt + 1, 30))
    ax.set_yticks(np.arange(0, max_time_to_mt + 1, 60))
    fig.colorbar(img2, label='Mean population added utility')
    ax.set_title(title)
    plt.savefig(f'./images/{filename}.jpg', dpi=300)
    plt.show()
Set up model#
# Set up outcome model
outcome_model = Clinical_outcome(mrs_dists)
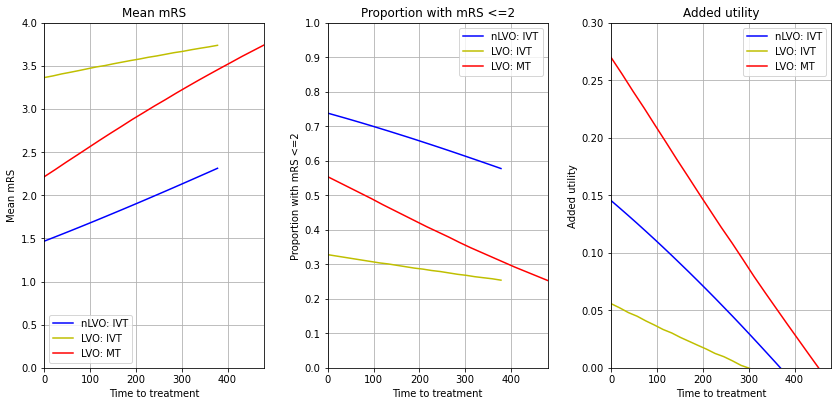
Individial treatment effects#
Here we consider the impact, and effect of time to treatment, for three cohorts independently:
nLVO receiving IVT
LVO receiving IVT only
LVO receiving MT (data based on trails where 85% had also received IVT)
##### nlvo IVT #####

# Set up variables
prop_lvo = 0.0; prop_nlvo = 1.0
prop_lvo_treated_ivt_only = 0
prop_lvo_treated_ivt_mt = 1
prop_nlvo_treated_ivt_only = 1
max_time_to_ivt = 6.3 * 60
max_time_to_mt = 480

times_ivt = np.linspace(0, max_time_to_ivt, 21)
time_to_mt = 480

# Get results
added_utility_nlvo_ivt = []
mean_mrs_nlvo_ivt = []
mrs_less_equal_2_nlvo_ivt = []

for ivt in times_ivt:
    outcomes = outcome_model.calculate_outcomes(
        ivt, time_to_mt, patients=10000, random_spacing=False)
    added_utility_nlvo_ivt.append(outcomes['nlvo_ivt_added_utility'])
    mean_mrs_nlvo_ivt.append(outcomes['nlvo_ivt_mean_mRS'])
    mrs_less_equal_2_nlvo_ivt.append(outcomes['nlvo_ivt_cum_probs'][2])


##### LVO IVT #####

# Set up variables
prop_lvo = 1.0; prop_nlvo = 0.0
prop_lvo_treated_ivt_only = 0
prop_lvo_treated_ivt_mt = 0
prop_nlvo_treated_ivt_only = 0
max_time_to_ivt = 6.3 * 60
max_time_to_mt = 480

times_ivt = np.linspace(0, max_time_to_ivt, 21)
time_to_mt = 480

# Get results
added_utility_lvo_ivt = []
mean_mrs_lvo_ivt = []
mrs_less_equal_2_lvo_ivt = []

for ivt in times_ivt:
    outcomes = outcome_model.calculate_outcomes(ivt, time_to_mt)
    added_utility_lvo_ivt.append(outcomes['lvo_ivt_added_utility'])
    mean_mrs_lvo_ivt.append(outcomes['lvo_ivt_mean_mRS'])
    mrs_less_equal_2_lvo_ivt.append(outcomes['lvo_ivt_cum_probs'][2])

##### LVO MT #####

# Set up variables
prop_lvo = 1.0; prop_nlvo = 0.0
prop_lvo_treated_ivt_only = 0
prop_lvo_treated_ivt_mt = 1
prop_nlvo_treated_ivt_only = 0
max_time_to_ivt = 6.3 * 60
max_time_to_mt = 480

times_mt = np.linspace(0, max_time_to_mt, 21)
time_to_ivt = 6/3 * 60

# Get results
added_utility_lvo_mt = []
mean_mrs_lvo_mt = []
mrs_less_equal_2_lvo_mt = []

for mt in times_mt:
    outcomes = outcome_model.calculate_outcomes(time_to_ivt, mt)
    added_utility_lvo_mt.append(outcomes['lvo_mt_added_utility'])
    mean_mrs_lvo_mt.append(outcomes['lvo_mt_mean_mRS'])
    mrs_less_equal_2_lvo_mt.append(outcomes['lvo_mt_cum_probs'][2])
# Plot
fig = plt.figure(figsize=(12,6))

# Mean mRS
ax1 = fig.add_subplot(131)
ax1.plot(times_ivt, mean_mrs_nlvo_ivt, c='b', label='nLVO: IVT')
ax1.plot(times_ivt, mean_mrs_lvo_ivt, c='y', label='LVO: IVT')
ax1.plot(times_mt, mean_mrs_lvo_mt, c='r', label='LVO: MT')
ax1.set_xlim(0, max_time_to_mt)
ax1.set_ylim(0, 4)
ax1.set_xlabel('Time to treatment')
ax1.set_ylabel('Mean mRS')
ax1.set_title('Mean mRS')
ax1.legend()
ax1.grid()

# mRS <= 2
ax2 = fig.add_subplot(132)
ax2.plot(times_ivt, mrs_less_equal_2_nlvo_ivt, c='b', label='nLVO: IVT')
ax2.plot(times_ivt, mrs_less_equal_2_lvo_ivt, c='y', label='LVO: IVT')
ax2.plot(times_mt, mrs_less_equal_2_lvo_mt, c='r', label='LVO: MT')
ax2.set_xlim(0, max_time_to_mt)
ax2.set_ylim(0, 1)
ax2.set_yticks(np.arange(0, 1.01, 0.1))
ax2.set_xlabel('Time to treatment')
ax2.set_ylabel('Proportion with mRS <=2')
ax2.set_title('Proportion with mRS <=2')
ax2.legend()
ax2.grid()

# Added utility
ax3 = fig.add_subplot(133)
ax3.plot(times_ivt, added_utility_nlvo_ivt, c='b', label='nLVO: IVT')
ax3.plot(times_ivt, added_utility_lvo_ivt, c='y', label='LVO: IVT')
ax3.plot(times_mt, added_utility_lvo_mt, c='r', label='LVO: MT')
ax3.set_xlim(0, max_time_to_mt)
ax3.set_ylim(0)
ax3.set_yticks(np.arange(0, 0.31, 0.05))
ax3.set_xlabel('Time to treatment')
ax3.set_ylabel('Added utility')
ax3.set_title('Added utility')
ax3.legend()
ax3.grid()

plt.tight_layout(pad=2)
plt.savefig('./images/time_to_treatment.jpg', dpi=300)

plt.show()
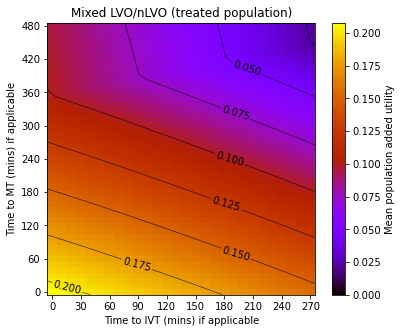
Combining patient groups#
Here we examined the combined effect of IVT and MT on outcomes across nLVO and LVO ischaemic strokes.
In this example, we make some basic assumptions:
20% of all stroke admissions receive IVT and/or MT.
35% of our treated population have LVO.
28.6% of LVO receive MT (this gives 10% of all ischaemic strokes receiving MT)
85% of LVO receiving MT have received IVT (from clinical trials data); for those 85% if the benefit of IVT exceed the benefit of MT (e.g. very early IVT, and very late MT), then the benefit is based on IVT.
15.5% nLVO receive thrombolysis (this brings total IVT to 20% use).
prop_lvo = 0.35
prop_nlvo = 1 - prop_lvo
proportion_of_lvo_mt_also_receiving_IVT = 0.85

prop_lvo_treated_ivt_only = 0
prop_lvo_treated_ivt_mt = 0.286 # 0.286 gives 10% final MT if 35% LVO
prop_nlvo_treated_ivt_only = 0.155 # 0.155 gives final 20% IVT

treated_population = (
    prop_nlvo * prop_nlvo_treated_ivt_only +
    prop_lvo * prop_lvo_treated_ivt_mt +
    prop_lvo * prop_lvo_treated_ivt_only
    )

print ('Proportion all admissions treated: ', \
     f'{treated_population:0.3f}')
print ('Proportion LVO admissions treated with MT: ', \
    f'{prop_lvo_treated_ivt_mt:0.3f}')
print ('Proportion LVO admissions treated with IVT only: ' \
    f'{prop_lvo_treated_ivt_only:0.3f}')
print ('Proportion nLVO admissions treated with IVT: ' \
    f'{prop_nlvo_treated_ivt_only:0.3f}')
print ('Proportion LVO MT also receiving IVT: ' \
    f'{proportion_of_lvo_mt_also_receiving_IVT:0.3f}')

max_time_to_ivt = 270
max_time_to_mt = 480


time_to_ivt = np.arange(0, max_time_to_ivt + 1, 10)
time_to_mt = np.arange(0, max_time_to_mt + 1, 10)
results = np.empty(shape=(len(time_to_mt), len(time_to_ivt)))


for x, ivt in enumerate(time_to_ivt):
    for y, mt in enumerate(time_to_mt):
        outcomes = outcome_model.calculate_outcomes(
            ivt, mt, patients=10000, random_spacing=False)
        added_utility_lvo_ivt = outcomes['lvo_ivt_added_utility']
        added_utility_lvo_mt = outcomes['lvo_mt_added_utility']
        added_utility_nlvo_ivt = outcomes['nlvo_ivt_added_utility']

        # If LVO-IVT is greater utility than LVO-MT then adjust MT for
        # proportion of patients receiving IVT
        if added_utility_lvo_ivt > added_utility_lvo_mt:
            diff = added_utility_lvo_ivt - added_utility_lvo_mt
            added_utility_lvo_mt += \
                diff * proportion_of_lvo_mt_also_receiving_IVT

        added_utility = (
            (added_utility_lvo_mt * prop_lvo * prop_lvo_treated_ivt_mt) +
            (added_utility_lvo_ivt * prop_lvo * prop_lvo_treated_ivt_only) +
            (added_utility_nlvo_ivt * prop_nlvo * prop_nlvo_treated_ivt_only)
                        )
        results[y,x] = added_utility

# Adjust outcome for just treated population
results = results / treated_population
Proportion all admissions treated:  0.201
Proportion LVO admissions treated with MT:  0.286
Proportion LVO admissions treated with IVT only: 0.000
Proportion nLVO admissions treated with IVT: 0.155
Proportion LVO MT also receiving IVT: 0.850
plot_results(results, time_to_ivt, time_to_mt,
             'Mixed LVO/nLVO (treated population)', 'utility_all')
plt.show()