Compare local thrombolysis decisions with benchmark decisions
Contents
Compare local thrombolysis decisions with benchmark decisions#
Plain English summary#
This notebook compares local thrombolysis decisions with those expected at the majority of a 30-hospital set of benchmark hospitals.
The XGBoost model uses 8 features:
Arrival-to-scan time
Infarction
Stroke severity
Precise onset time
Prior disability level
Stroke team
Use of AF anticoagulants
Onset-to-arrival time
Benchmark decisions are decisions made at the majority of the top 30 hospitals as judged by their expected thrombolysis use in a standard 10K cohort of patients (a set of 10,000 patients that is passed through the models of decision-making at each hospital).
If benchmark decisions were used at all hopsitals, then thrombolysis use would increase 22%. Thrombolysis use at the bottom 30 thrombolsying hospitals would increase 63%.
Aims#
Predict thrombolysis use of 10K cohort of patients at all 132 hospitals.
Get predicted thrombolysis decisions for all patients at the 30 benchmark hospitals.
Check similarity between local decisions and benchmark decisions.
Estimate thrombolysis use at each hospital if benchmark decisions made.
Save comparison of local and benchmark decisions.
Observations#
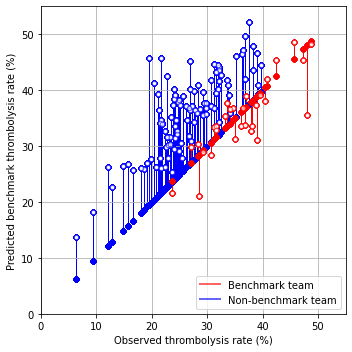
82.8% decisions are identical between local and benchmark decisions.
Thrombolysis use would be increased 22.6% if benchmark decisions were made at all hospitals.
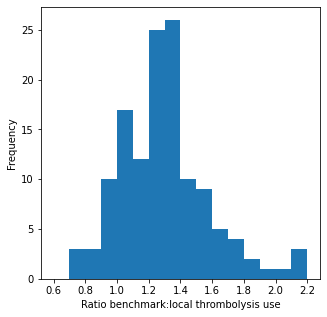
The ration of benchmark:local thrombolysis use was 0.7 to 2.2.
# Turn warnings off to keep notebook tidy
import warnings
warnings.filterwarnings("ignore")

import os
import matplotlib.pyplot as plt
import numpy as np
import pandas as pd

import matplotlib.cm as cm
import matplotlib.colors as colors
from matplotlib.lines import Line2D

from xgboost import XGBClassifier
Load data on predicted 10K corhort thrombolysis use at each hospital#
thrombolysis_by_hosp = pd.read_csv(
    './output/10k_thrombolysis_rate_by_hosp_key_features.csv', index_col='stroke_team')
thrombolysis_by_hosp.sort_values(
    'Thrombolysis rate', ascending=False, inplace=True)
thrombolysis_by_hosp.head()
| Thrombolysis rate | |
|---|---|
| stroke_team | |
| VKKDD9172T | 0.4610 |
| GKONI0110I | 0.4356 |
| CNBGF2713O | 0.4207 |
| HPWIF9956L | 0.4191 |
| MHMYL4920B | 0.3981 |
top_30_hopsitals = list(thrombolysis_by_hosp.head(30).index)
bottom_30_hopsitals = list(thrombolysis_by_hosp.tail(30).index)
Get predicted decision for all patients at each hopsital#
Combine test results for k_fold data, so that all inviduals are predicted from a test set.
data_loc = '../data/kfold_5fold/'

train_data, test_data = [], []

# Load features (and add S2Thrombolysis)
number_of_features_to_use = 8
key_features = pd.read_csv('./output/feature_selection.csv')
key_features = list(key_features['feature'])[:number_of_features_to_use]
key_features.append('S2Thrombolysis')

for i in range(5):
    train = pd.read_csv(data_loc + 'train_{0}.csv'.format(i))
    train = train[key_features]
    train_data.append(train)
    test = pd.read_csv(data_loc + 'test_{0}.csv'.format(i))
    test = test[key_features]
    test_data.append(test)
# Set up list to store models
models = []

# Set up lists for observed and predicted
observed = []
predicted_proba = []
predicted = []

# Set up list for feature importances
feature_importance = []

# Loop through k folds
for k_fold in range(5):

    # Get k fold split
    train = train_data[k_fold]
    test = test_data[k_fold]

    # Get X and y
    X_train = train.drop('S2Thrombolysis', axis=1)
    X_test = test.drop('S2Thrombolysis', axis=1)
    y_train = train['S2Thrombolysis']
    y_test = test['S2Thrombolysis']

    # One hot encode hospitals
    X_train_hosp = pd.get_dummies(X_train['StrokeTeam'], prefix = 'team')
    X_train = pd.concat([X_train, X_train_hosp], axis=1)
    X_train.drop('StrokeTeam', axis=1, inplace=True)
    X_test_hosp = pd.get_dummies(X_test['StrokeTeam'], prefix = 'team')
    X_test = pd.concat([X_test, X_test_hosp], axis=1)
    X_test.drop('StrokeTeam', axis=1, inplace=True)

    # Define model
    model = XGBClassifier(verbosity = 0, seed=42, learning_rate=0.5)

    # Fit model
    model.fit(X_train, y_train)
    models.append(model)

    # Get predicted probabilities
    y_probs = model.predict_proba(X_test)[:,1]
    observed.append(y_test)
    predicted_proba.append(y_probs)

    # Get feature importances
    importance = model.feature_importances_
    feature_importance.append(importance)

    # Get class
    y_class = y_probs >= 0.5
    y_class = np.array(y_class) * 1.0
    predicted.append(y_class)

    # Print accuracy
    accuracy = np.mean(y_class == y_test)
    print(
        f'Run {k_fold+1}, accuracy: {accuracy:0.3f}')
Run 1, accuracy: 0.846
Run 2, accuracy: 0.853
Run 3, accuracy: 0.845
Run 4, accuracy: 0.849
Run 5, accuracy: 0.844
Combine test results in a dataframe.
thrombolysis_predictions_at_own_unit_k_fold = []

for i in range(5):
    df = pd.DataFrame()
    df['unit'] = test_data[i]['StrokeTeam']
    df['observed'] = observed[i]
    df['predicted_thrombolysis'] = predicted[i]
    df['predicted_proba'] = predicted_proba[i]
    thrombolysis_predictions_at_own_unit_k_fold.append(df)

thrombolysis_predictions_at_own_unit = pd.concat(
    thrombolysis_predictions_at_own_unit_k_fold, axis=0)
Get predictions at 30 benchmark hospitals#
hospitals = top_30_hopsitals
top_30_predictions = []

# Loop through k folds
for k_fold in range(5):

    k_fold_predictions = []

    # Get predicted probabilities and class
    model = models[k_fold]

    for hospital in hospitals:

        # Get k fold split
        train = train_data[k_fold]
        test = test_data[k_fold]

        # Get X and y
        X_train = train.drop('S2Thrombolysis', axis=1)
        X_test = test.drop('S2Thrombolysis', axis=1)
        y_train = train['S2Thrombolysis']
        y_test = test['S2Thrombolysis']

        # One hot encode hospitals
        X_train_hosp = pd.get_dummies(X_train['StrokeTeam'], prefix = 'team')
        X_train = pd.concat([X_train, X_train_hosp], axis=1)
        X_train.drop('StrokeTeam', axis=1, inplace=True)
        X_test_hosp = pd.get_dummies(X_test['StrokeTeam'], prefix = 'team')
        X_test = pd.concat([X_test, X_test_hosp], axis=1)
        X_test.drop('StrokeTeam', axis=1, inplace=True)

        # Get test data without thrombolysis hospital or stroke team
        X_test_no_hosp = test.drop(['S2Thrombolysis', 'StrokeTeam'], axis=1)

        # Copy hospital dataframe and change hospital ID (after setting all to zero)
        X_test_adjusted_hospital = X_test_hosp.copy()
        X_test_adjusted_hospital.loc[:,:] = 0
        team = "team_" + hospital
        X_test_adjusted_hospital[team] = 1

        X_test_adjusted = pd.concat(
            [X_test_no_hosp, X_test_adjusted_hospital], axis=1)


        y_probs = model.predict_proba(X_test_adjusted)[:,1]
        y_pred = y_probs > 0.5
        k_fold_predictions.append(y_pred * 1)

    top_30_predictions.append(k_fold_predictions)
Reformat top 30 hospital predictions.
top_30_predictions has [a][b][c] where: [a] = k_fold [b] = hospital [c] = individual
benchmark_decisions_k_fold = []

for i in range(5):
    df = pd.DataFrame()
    df['home_unit'] = test_data[i]['StrokeTeam']
    k_fold_predictions = top_30_predictions[i][:][:]
    benchmark_yes_count = np.array(k_fold_predictions).sum(axis=0)
    df['majority_vote'] = (benchmark_yes_count >= 15) * 1.0
    benchmark_decisions_k_fold.append(df)

benchmark_decisions = pd.concat(benchmark_decisions_k_fold,  axis=0)
benchmark_decisions.head()
| home_unit | majority_vote | |
|---|---|---|
| 0 | TXHRP7672C | 1.0 |
| 1 | SQGXB9559U | 1.0 |
| 2 | LFPMM4706C | 0.0 |
| 3 | MHMYL4920B | 0.0 |
| 4 | EQZZZ5658G | 1.0 |
thrombolysis_predictions_at_own_unit['majority_vote'] = \
    benchmark_decisions['majority_vote']
thrombolysis_predictions_at_own_unit.head()
| unit | observed | predicted_thrombolysis | predicted_proba | majority_vote | |
|---|---|---|---|---|---|
| 0 | TXHRP7672C | 1 | 1.0 | 0.880155 | 1.0 |
| 1 | SQGXB9559U | 1 | 1.0 | 0.627783 | 1.0 |
| 2 | LFPMM4706C | 0 | 0.0 | 0.042199 | 0.0 |
| 3 | MHMYL4920B | 0 | 0.0 | 0.000084 | 0.0 |
| 4 | EQZZZ5658G | 1 | 1.0 | 0.916311 | 1.0 |
Check similarity of own decisions vs benchmark decisions.#
same_decision = (
    thrombolysis_predictions_at_own_unit['observed'] ==
    thrombolysis_predictions_at_own_unit['majority_vote'])
print(f'Proportion same decision {same_decision.mean():0.3f}')
Proportion same decision 0.828
Count number thrombolysed at each hospital compared with benchmark#
thrombolysis_counts = (thrombolysis_predictions_at_own_unit.groupby('unit').agg('sum').drop(
        'predicted_proba', axis=1))
thrombolysis_counts.head()
| observed | predicted_thrombolysis | majority_vote | |
|---|---|---|---|
| unit | |||
| AGNOF1041H | 307 | 307.0 | 402.0 |
| AKCGO9726K | 528 | 512.0 | 556.0 |
| AOBTM3098N | 128 | 127.0 | 200.0 |
| APXEE8191H | 130 | 116.0 | 171.0 |
| ATDID5461S | 75 | 74.0 | 92.0 |
Estimate change in thrombolysis rate if benchmark decisions used at all hospitals#
change = (thrombolysis_counts['majority_vote'].sum() /
          thrombolysis_counts['observed'].sum())

percent_change = (change -1) * 100

print (f'Percent change in thrombolysis with benchmark vote: '\
       f'{percent_change:.1f}%')
Percent change in thrombolysis with benchmark vote: 22.1%
Estimate change in thrombolysis rate at bottom 30 thrombolysing hospitals if benchmark decisions used#
change = (thrombolysis_counts.loc[bottom_30_hopsitals]['majority_vote'].sum() /
          thrombolysis_counts.loc[bottom_30_hopsitals]['observed'].sum())

percent_change = (change -1) * 100

print (f'Percent increase in thrombolysis at bottom 30 hospitals with '\
       f'benchmark decisions: {percent_change:.1f}%')
Percent increase in thrombolysis at bottom 30 hospitals with benchmark decisions: 63.1%
fig = plt.figure(figsize=(5,5))
ax = fig.add_subplot()
ratio = thrombolysis_counts['majority_vote'] / thrombolysis_counts['observed']
ax.hist(ratio, bins = np.arange(0.6, 2.3, 0.1))
ax.set_xlabel('Ratio benchmark:local thrombolysis use')
ax.set_ylabel('Frequency')
plt.show()
Add patient counts at units, and calculate thrombolysis rate#
unit_count = thrombolysis_predictions_at_own_unit.groupby(
    'unit').count()['observed']
thrombolysis_counts['patients'] = unit_count
thrombolysis_counts['observed_rate'] = (
    thrombolysis_counts['observed'] / thrombolysis_counts['patients'])
thrombolysis_counts['benchmark_rate'] = (
    thrombolysis_counts['majority_vote'] / thrombolysis_counts['patients'])
Add benchmark label
thrombolysis_counts['benchmark_unit'] = False
thrombolysis_counts['benchmark_unit'].loc[top_30_hopsitals] = True
thrombolysis_counts.head()
| observed | predicted_thrombolysis | majority_vote | patients | observed_rate | benchmark_rate | benchmark_unit | |
|---|---|---|---|---|---|---|---|
| unit | |||||||
| AGNOF1041H | 307 | 307.0 | 402.0 | 871 | 0.352468 | 0.461538 | False |
| AKCGO9726K | 528 | 512.0 | 556.0 | 1428 | 0.369748 | 0.389356 | True |
| AOBTM3098N | 128 | 127.0 | 200.0 | 585 | 0.218803 | 0.341880 | False |
| APXEE8191H | 130 | 116.0 | 171.0 | 574 | 0.226481 | 0.297909 | False |
| ATDID5461S | 75 | 74.0 | 92.0 | 312 | 0.240385 | 0.294872 | False |
fig = plt.figure(figsize=(5,5))
ax = fig.add_subplot()

# Plot non-benchmark hospitals in blue
mask = thrombolysis_counts['benchmark_unit'] == False
non_bench = thrombolysis_counts[mask]

for i, val in non_bench.iterrows():
    start = [non_bench['observed_rate'] * 100,
             non_bench['observed_rate'] * 100]
    end = [non_bench['observed_rate'] * 100,
             non_bench['benchmark_rate'] * 100]
    ax.plot(start, end, c='b', lw=1, zorder=1)
    ax.scatter(start[0], start[1], marker='o', facecolors='b', edgecolors='b',
               s=20, zorder=2, alpha=0.6)
    ax.scatter(end[0], end[1], marker='o', facecolors='w', edgecolors='b',
               s=20, zorder=2, alpha=0.6)

# Plot benchmark hospitals in red
mask = thrombolysis_counts['benchmark_unit'] == True
bench = thrombolysis_counts[mask]

for i, val in bench.iterrows():
    start = [bench['observed_rate'] * 100,
             bench['observed_rate'] * 100]
    end = [bench['observed_rate'] * 100,
             bench['benchmark_rate'] * 100]
    ax.plot(start, end, c='r', lw=1, zorder=1)
    ax.scatter(start[0], start[1], marker='o', facecolors='r', edgecolors='r',
               s=20, zorder=2, alpha=0.6)
    ax.scatter(end[0], end[1], marker='o', facecolors='w', edgecolors='r',
               s=20, zorder=2, alpha=0.6)

# Add mods
ax.set_xlabel('Observed thrombolysis rate (%)')
ax.set_ylabel('Predicted benchmark thrombolysis rate (%)')
ax.set_xlim(0, 55)
ax.set_ylim(0, 55)
ax.grid()

custom_lines = [Line2D([0], [0], color='r', alpha=0.6, lw=2),
                Line2D([0], [0], color='b', alpha = 0.6,lw=2)]

plt.legend(custom_lines, ['Benchmark team', 'Non-benchmark team'],
          loc='lower right')

plt.tight_layout()
plt.savefig('output/benchmark_thrombolysis_key_features.jpg', dpi=300)

plt.show()
Save comparisons of decisions#
thrombolysis_predictions_at_own_unit.to_csv(
    './predictions/benchmark_decisions_combined_xgb_key_features.csv',
    index=False)
test_collated = pd.concat(test_data, axis=0)
test_collated.to_csv('./predictions/test_features_collated_key_features.csv',
                     index=False)
Observations#
82.9% decisions are identical between local and benchmark decisions.
Thrombolysis use would be increased 22.6% if benchmark decisions were made at all hospitals.
The ration of benchmark:local thrombolysis use was 0.7 to 2.2.