Emergency stroke admissions predictions#
TO DO why MSOA? Presumably LSOA are too small? (AL 11/Jul/24)
The aim of this notebook is to predict admissions at a MSOA level, based on demographic data. This allows for:
Projection of admissions into the future based on age profile changes (if nothing else changes)
Prediction of admissions in Wales, where we do not have localised admission data
The prediction is based on Office of National Statistics:
Index of multiple deprivation
Number of people in each MSOA in three age bands (0-64, 65-79, and 80+)
The number of people in each MSOA in three hwalth bands (good, fair, bad)
After prediction at MSOA level, admissions are distrubted among LSOAs in each MSOA.
import matplotlib.pyplot as plt
import numpy as np
import pandas as pd
from scipy import stats
from sklearn import metrics
from sklearn.linear_model import LinearRegression
from sklearn.model_selection import KFold

# Turn warnings off to keep notebook tidy
import warnings
warnings.filterwarnings("ignore")
Load data#
data = pd.read_csv('./data/msoa_collated.csv', index_col='MSOA')

# Limit to England data
mask = data['country'] == 'E'
data = data[mask]
data = data.drop('country', axis=1)
data = data.drop('All persons', axis=1)

data.head()
| admissions | IMD2019Score | 0-64 | 65-79 | 80+ | good_health | fair health | bad health | |
|---|---|---|---|---|---|---|---|---|
| MSOA | ||||||||
| Adur 001 | 14.333333 | 16.924833 | 6905.0 | 1339.0 | 571.0 | 6799 | 1251 | 474 |
| Adur 002 | 7.333333 | 6.470400 | 5431.0 | 1345.0 | 487.0 | 5537 | 838 | 259 |
| Adur 003 | 9.333333 | 13.733400 | 5745.0 | 1157.0 | 452.0 | 5820 | 969 | 311 |
| Adur 004 | 21.000000 | 26.199857 | 8583.0 | 1371.0 | 628.0 | 7872 | 1546 | 709 |
| Adur 005 | 13.666667 | 11.794800 | 6995.0 | 1479.0 | 585.0 | 7106 | 1081 | 339 |
Split into X and y#
X = data.drop('admissions', axis=1)
y = data['admissions']
Create k-fold splits#
# Set up splits
number_of_splits = 6
skf = KFold(n_splits = number_of_splits, shuffle=True, random_state=42)
X_fields = list(X)
X = X.values
y = y.values
skf.get_n_splits(X, y)
6
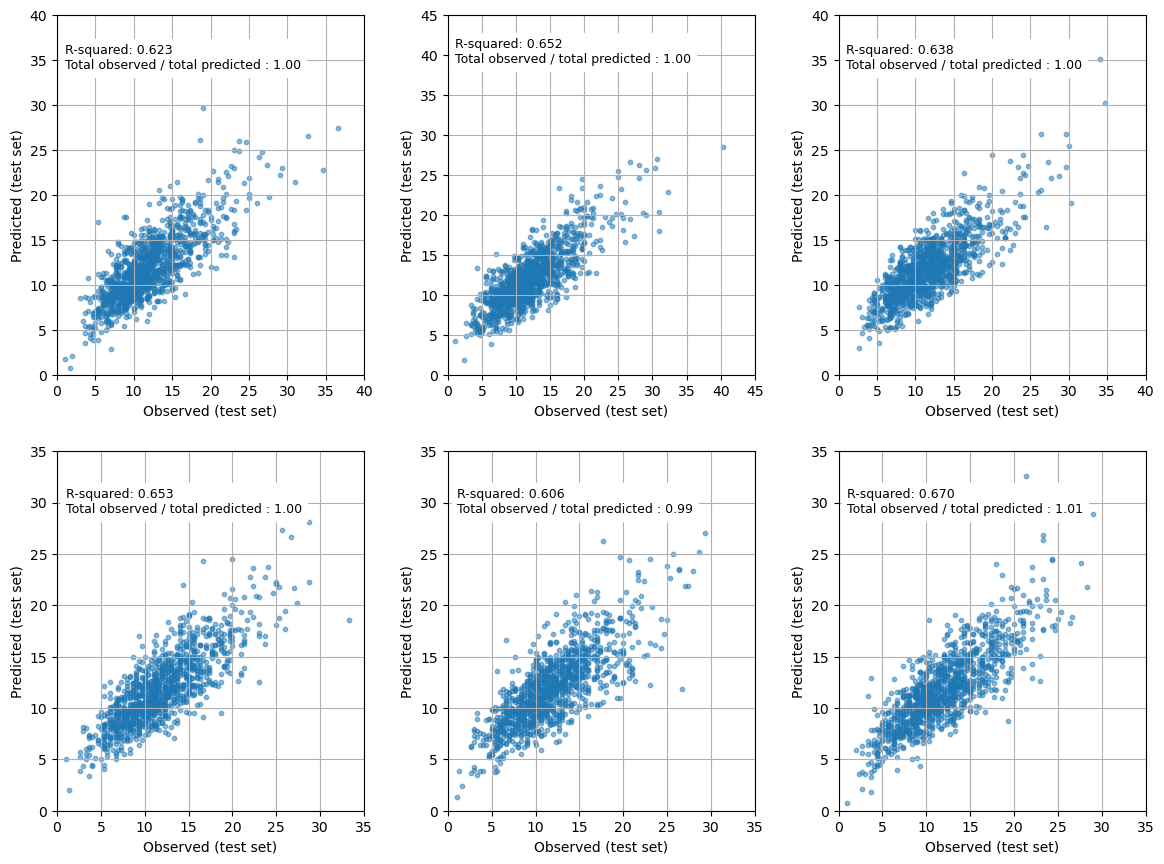
Linear regression#
r_square_results = []
observed = []
predictions = []
coefficients = []

# Loop through the k-fold splits
for train_index, test_index in skf.split(X, y):

    # Get X and Y train/test
    X_train, X_test = X[train_index], X[test_index]
    y_train, y_test = y[train_index], y[test_index]
    observed.append(y_test)

    # Fit model
    model = LinearRegression().fit(X_train, y_train)

    # get predictions
    y_pred = model.predict(X_test)
    predictions.append(y_pred)
    r_square = metrics.r2_score(y_test, y_pred)
    r_square_results.append(r_square)
    coefficients.append(model.coef_)

mean_r_square = np.mean(r_square_results)
sem = np.std(r_square_results) / number_of_splits ** 0.5
print (f'Mean r-squared (sem): {mean_r_square:0.3f} ({sem:0.3f})')
Mean r-squared (sem): 0.640 (0.009)
mean_coefficients = np.mean(coefficients, axis=0)
pd.Series(mean_coefficients, index=X_fields)
IMD2019Score    0.011699
0-64           -0.000017
65-79           0.001630
80+             0.011814
good_health    -0.000076
fair health     0.004081
bad health      0.004709
dtype: float64
fig = plt.figure(figsize=(12,9))

for k in range (number_of_splits):

    ax = fig.add_subplot(2,3,k+1)


    max_val = np.max([np.max(observed[k]), np.max(predictions[k])]) + 1
    max_val = 5 + (int(max_val/5)*5)

    ratio = np.sum(observed[k]) / np.sum(predictions[k])

    ax.scatter(observed[k], predictions[k], s=10, alpha=0.5)

    ax.set_xlim(0, max_val)
    ax.set_ylim(0, max_val)
    ax.grid()
    ax.set_xlabel('Observed (test set)')
    ax.set_ylabel('Predicted (test set)')
    ticks = np.arange(0,max_val+1, 5)
    ax.set_xticks(ticks)
    ax.set_yticks(ticks)
    text = (f'R-squared: {r_square_results[k]:0.3f}\n' +
            f'Total observed / total predicted : {ratio:0.2f}')
    ax.text(1, max_val-6, text, backgroundcolor='1.0', fontsize=9)

plt.tight_layout(pad=2)
plt.show()
Make predictions for England and Wales#
data = pd.read_csv('./data/msoa_collated.csv', index_col='MSOA')

#Train model on all England data
mask = data['country'] == 'E'
X_train = data[mask]
y_train = data[mask]['admissions']
X_train = X_train[X_fields]

# Fit model and get admissions
model = LinearRegression().fit(X_train, y_train)
predictions = model.predict(data[X_fields])
predicted_admissions = pd.DataFrame(
    predictions, columns=['predicted admissions'], index=data.index)

# Get MSOA for each LSOA
lsoa_msoa = pd.read_csv('./data/lsoa_to_msoa.csv')
lsoa_msoa['count'] = 1
lsoa_counts = lsoa_msoa.groupby('msoa11nm').sum()
# Create dataframe with admissions per MSOA and number of LSOA per MSOA
predicted_admissions = \
    pd.merge(predicted_admissions, lsoa_counts, left_index=True, right_index=True, how='left')

# Calculate the number of admissions for LSOA in each MSOA
predicted_admissions['LSOA_predicted_admissions'] = \
    predicted_admissions['predicted admissions'] / predicted_admissions['count']

# Add predictions per LSOA to all LSOAs
lsoa_predictions = pd.merge(
    lsoa_msoa, predicted_admissions, left_on='msoa11nm', right_index=True, how='left')

# Clean table
cols = ['lsoa11cd', 'lsoa11nm', 'msoa11cd', 'msoa11nm', 'country', 'LSOA_predicted_admissions']
lsoa_predictions = lsoa_predictions[cols]

mask = (lsoa_predictions['country'] == 'E' ) | (lsoa_predictions['country'] == 'W')
lsoa_predictions = lsoa_predictions[mask]


lsoa_predictions.head()
| lsoa11cd | lsoa11nm | msoa11cd | msoa11nm | country | LSOA_predicted_admissions | |
|---|---|---|---|---|---|---|
| 0 | E01000001 | City of London 001A | E02000001 | City of London 001 | E | 1.569672 |
| 1 | E01000002 | City of London 001B | E02000001 | City of London 001 | E | 1.569672 |
| 2 | E01000003 | City of London 001C | E02000001 | City of London 001 | E | 1.569672 |
| 3 | E01000005 | City of London 001E | E02000001 | City of London 001 | E | 1.569672 |
| 4 | E01000006 | Barking and Dagenham 016A | E02000017 | Barking and Dagenham 016 | E | 1.767059 |
lsoa_predictions.to_csv('outputs/lsoa_predicted_admissions.csv', index=False)