Association between patient features on use of thrombolysis
Contents
Association between patient features on use of thrombolysis#
Aims#
Examine thrombolysis use (in all arrivals, and the subset of those who arrive within 4 hours of known onset) according to:
Disability (Rankin) before stroke
Stroke severity (NIHSS)
Gender
Ethnicity
Age group
Onset known
Arrival by ambulance
Examine thrombolysis use in the absence and presence of co-morbidities.
Note: The association of particular features with use of thrombolysis does not imply that these relationships are causal.
Examine reasons given for not giving thrombolysis.
Import libraries and data#
Data has been resticted to stroke teams with at least 300 admissions, with at least 10 patients receiving thrombolysis, over three years.
# import libraries
import matplotlib.pyplot as plt
import numpy as np
import pandas as pd

# import data
raw_data = pd.read_csv(
    './../data/2019-11-04-HQIP303-Exeter_MA.csv', low_memory=False)
headings = list(raw_data)
print (headings)
['StrokeTeam', 'PatientUID', 'Pathway', 'S1AgeOnArrival', 'MoreEqual80y', 'S1Gender', 'S1Ethnicity', 'S1OnsetInHospital', 'S1OnsetToArrival_min', 'S1OnsetDateType', 'S1OnsetTimeType', 'S1ArriveByAmbulance', 'S1AdmissionHour', 'S1AdmissionDay', 'S1AdmissionQuarter', 'S1AdmissionYear', 'CongestiveHeartFailure', 'Hypertension', 'AtrialFibrillation', 'Diabetes', 'StrokeTIA', 'AFAntiplatelet', 'AFAnticoagulent', 'AFAnticoagulentVitK', 'AFAnticoagulentDOAC', 'AFAnticoagulentHeparin', 'S2INR', 'S2INRHigh', 'S2INRNK', 'S2NewAFDiagnosis', 'S2RankinBeforeStroke', 'Loc', 'LocQuestions', 'LocCommands', 'BestGaze', 'Visual', 'FacialPalsy', 'MotorArmLeft', 'MotorArmRight', 'MotorLegLeft', 'MotorLegRight', 'LimbAtaxia', 'Sensory', 'BestLanguage', 'Dysarthria', 'ExtinctionInattention', 'S2NihssArrival', 'S2BrainImagingTime_min', 'S2StrokeType', 'S2Thrombolysis', 'Haemorrhagic', 'TimeWindow', 'Comorbidity', 'Medication', 'Refusal', 'Age', 'Improving', 'TooMildSevere', 'TimeUnknownWakeUp', 'OtherMedical', 'S2ThrombolysisTime_min', 'S2TIAInLastMonth']
Restrict original data to hospitals with at least 300 admissions + 10 thrombolysis patients#
keep = []

groups = raw_data.groupby('StrokeTeam') # creates a new object of groups of data

for index, group_df in groups: # each group has an index and a dataframe of data

    # Skip if total admissions less than 300 or total thrombolysis < 10
    admissions = group_df.shape[0]
    thrombolysis_received = group_df['S2Thrombolysis'] == 'Yes'
    if (admissions < 300) or (thrombolysis_received.sum() < 10):
        continue

    else:
        keep.append(group_df)

# Concatenate output
data = pd.DataFrame()
data = pd.concat(keep)

# Convert thromboilysis to boolean
data['thrombolysis_given'] = data['S2Thrombolysis'] == 'Yes'

print (data.shape)
(239505, 63)
Get out-of-hopsital stroke onset arrivals within 4 hours of known stroke onset#
# Get out of hospital arrivals
mask = data['S1OnsetInHospital'] == 'No'
data = data[mask]

# Get arrivals within 4 hours of known stroke onset
mask = data['S1OnsetToArrival_min'] <= 240
data_4hr = data[mask]
Breakdown of thrombolysis use by feature#
Rankin before stroke#
# All admissions
rankin_before_stroke_all = \
    data.groupby('S2RankinBeforeStroke').mean()['thrombolysis_given']
rankin_before_stroke_all.rename('All', inplace=True)

# Admissions within 4 hours of arrival
rankin_before_stroke_4hr = \
    data_4hr.groupby('S2RankinBeforeStroke').mean()['thrombolysis_given']
rankin_before_stroke_4hr.rename('4hr', inplace=True)

# Combine
rankin_before_stroke = \
    pd.concat([rankin_before_stroke_all, rankin_before_stroke_4hr], axis=1)
rankin_before_stroke = rankin_before_stroke.round(3)
rankin_before_stroke *= 100
rankin_before_stroke
| All | 4hr | |
|---|---|---|
| S2RankinBeforeStroke | ||
| 0 | 14.2 | 34.9 |
| 1 | 10.8 | 28.6 |
| 2 | 9.0 | 24.0 |
| 3 | 8.7 | 21.5 |
| 4 | 6.5 | 15.0 |
| 5 | 4.3 | 9.8 |
# Set up figure
fig = plt.figure(figsize=(5,5))
ax = fig.add_subplot()
x = rankin_before_stroke.index
y1 = rankin_before_stroke['All']
y2 = rankin_before_stroke['4hr']
ax.plot(x, y1, label='All arrivals')
ax.plot(x, y2, label='4 Hour arrivals')
ax.set_xlabel('Disability (Rankin) before stroke')
ax.set_ylabel('Thrombolysis use (%)')
ax.legend()
plt.tight_layout()
plt.savefig('output/thrombolysis_use_by_rankin_before_stroke.jpg', dpi=300)
plt.show()
Stroke severity#
# All admissions
NIHSS_all = data.groupby('S2NihssArrival').mean()['thrombolysis_given']
NIHSS_all.rename('All', inplace=True)

# Admissions within 4 hours of arrival
NIHSS_4hr = data_4hr.groupby('S2NihssArrival').mean()['thrombolysis_given']
NIHSS_4hr.rename('4hr', inplace=True)

# Combine
NIHSS = pd.concat([NIHSS_all, NIHSS_4hr], axis=1) * 100
NIHSS = NIHSS.round(1)
NIHSS
| All | 4hr | |
|---|---|---|
| S2NihssArrival | ||
| 0.0 | 0.6 | 2.1 |
| 1.0 | 1.1 | 3.8 |
| 2.0 | 2.5 | 8.3 |
| 3.0 | 4.9 | 15.0 |
| 4.0 | 9.7 | 28.7 |
| 5.0 | 14.0 | 36.8 |
| 6.0 | 16.4 | 39.9 |
| 7.0 | 18.8 | 42.4 |
| 8.0 | 21.0 | 44.7 |
| 9.0 | 21.6 | 44.2 |
| 10.0 | 21.9 | 43.4 |
| 11.0 | 24.0 | 46.1 |
| 12.0 | 23.9 | 43.8 |
| 13.0 | 24.7 | 43.9 |
| 14.0 | 25.9 | 45.9 |
| 15.0 | 25.9 | 45.0 |
| 16.0 | 26.4 | 44.4 |
| 17.0 | 26.2 | 44.3 |
| 18.0 | 26.6 | 45.1 |
| 19.0 | 26.7 | 46.2 |
| 20.0 | 23.7 | 42.3 |
| 21.0 | 24.3 | 42.6 |
| 22.0 | 24.1 | 41.4 |
| 23.0 | 25.0 | 44.2 |
| 24.0 | 24.7 | 42.7 |
| 25.0 | 22.2 | 39.3 |
| 26.0 | 17.5 | 31.0 |
| 27.0 | 17.6 | 31.8 |
| 28.0 | 12.5 | 24.1 |
| 29.0 | 12.6 | 24.0 |
| 30.0 | 9.8 | 19.4 |
| 31.0 | 8.9 | 18.1 |
| 32.0 | 8.3 | 16.5 |
| 33.0 | 6.0 | 12.7 |
| 34.0 | 4.9 | 10.0 |
| 35.0 | 4.2 | 7.7 |
| 36.0 | 2.4 | 5.0 |
| 37.0 | 3.6 | 6.8 |
| 38.0 | 5.7 | 9.9 |
| 39.0 | 6.5 | 11.4 |
| 40.0 | 0.0 | 0.0 |
| 41.0 | 0.0 | 0.0 |
| 42.0 | 1.6 | 2.7 |
# Set up figure
fig = plt.figure(figsize=(5,5))
ax = fig.add_subplot()
x = NIHSS.index
y1 = NIHSS['All']
y2 = NIHSS['4hr']
ax.plot(x, y1, label='All arrivals')
ax.plot(x, y2, label='4 Hour arrivals')
ax.set_xlabel('Stroke severity (NIHSS) on arrival')
ax.set_ylabel('Thrombolysis use (%)')
ax.legend()

plt.tight_layout()
plt.savefig('output/thrombolysis_use_by_arrival_nihss.jpg', dpi=300)
plt.show()
Show thrombolysis use by NIHSS cutoff of 0-10 or 11+
# All arrivals

mask = (data['S2NihssArrival'] >= 0) & (data['S2NihssArrival'] <= 10)
thrombolisis_use = data[mask]['thrombolysis_given'].mean()
print (
    f'Thrombolysis use in NIHSS 0-10, all arrivals: {thrombolisis_use:0.3f}')

mask = data['S2NihssArrival'] >= 11
thrombolisis_use = data[mask]['thrombolysis_given'].mean()
print (
    f'Thrombolysis use in NIHSS 11+, all arrivals: {thrombolisis_use:0.3f}')
Thrombolysis use in NIHSS 0-10, all arrivals: 0.086
Thrombolysis use in NIHSS 11+, all arrivals: 0.231
# 4 Hour arrivals
mask = (data_4hr['S2NihssArrival'] >= 0) & (data_4hr['S2NihssArrival'] <= 10)
thrombolisis_use = data_4hr[mask]['thrombolysis_given'].mean()
print (
    f'Thrombolysis use in NIHSS 0-10, 4 hour arrivals: {thrombolisis_use:0.3f}')

mask = data_4hr['S2NihssArrival'] >= 11
thrombolisis_use = data_4hr[mask]['thrombolysis_given'].mean()
print (
    f'Thrombolysis use in NIHSS 11+, 4 hour arrivals: {thrombolisis_use:0.3f}')
Thrombolysis use in NIHSS 0-10, 4 hour arrivals: 0.245
Thrombolysis use in NIHSS 11+, 4 hour arrivals: 0.412
Gender#
# All admissions
gender_all = data.groupby('S1Gender').mean()['thrombolysis_given']
gender_all.rename('All', inplace=True)

# Admissions within 4 hours of arrival
gender_4hr = data_4hr.groupby('S1Gender').mean()['thrombolysis_given']
gender_4hr.rename('4hr', inplace=True)

# Combine
gender = pd.concat([gender_all, gender_4hr], axis=1) * 100
gender = gender.round(1)
gender
| All | 4hr | |
|---|---|---|
| S1Gender | ||
| Female | 11.3 | 28.2 |
| Male | 12.3 | 30.8 |
Ethnicity#
# All admissions
ethnicity_all = data.groupby('S1Ethnicity').mean()['thrombolysis_given']
ethnicity_all.rename('All', inplace=True)

# Admissions within 4 hours of arrival
ethnicity_4hr = data_4hr.groupby('S1Ethnicity').mean()['thrombolysis_given']
ethnicity_4hr.rename('4hr', inplace=True)

# Combine
ethnicity = pd.concat([ethnicity_all, ethnicity_4hr], axis=1) * 100
ethnicity = ethnicity.round(1)
ethnicity
| All | 4hr | |
|---|---|---|
| S1Ethnicity | ||
| Asian | 12.1 | 30.0 |
| Black | 10.2 | 29.2 |
| Mixed | 11.7 | 32.3 |
| Other | 14.4 | 34.3 |
| White | 11.6 | 29.1 |
Age group#
# All admissions
age_group_all = data.groupby('S1AgeOnArrival').mean()['thrombolysis_given']
age_group_all.rename('All', inplace=True)

# Admissions within 4 hours of arrival
age_group_4hr = data_4hr.groupby('S1AgeOnArrival').mean()['thrombolysis_given']
age_group_4hr.rename('4hr', inplace=True)

# Combine
age_group = pd.concat([age_group_all, age_group_4hr], axis=1) * 100
age_group = age_group.round(3)

# Re-order
order = ['[15,20)', '[20,25)', '[25,30)', '[30,35)', '[35,40)',
       '[40,45)', '[45,50)', '[50,55)', '[55,60)', '[60,65)', '[65,70)',
       '[70,75)', '[75,80)', '[80,85)', '[85,90)', '[90,95)', '[95,100)',
        '[100,120]']
age_group = age_group.loc[order]
age_group.set_index(np.arange(15, 101, 5), inplace=True)
age_group
| All | 4hr | |
|---|---|---|
| 15 | 17.470 | 42.029 |
| 20 | 13.402 | 33.621 |
| 25 | 15.371 | 37.229 |
| 30 | 14.624 | 36.164 |
| 35 | 15.697 | 36.794 |
| 40 | 15.274 | 37.671 |
| 45 | 14.863 | 36.277 |
| 50 | 14.189 | 36.692 |
| 55 | 13.091 | 34.348 |
| 60 | 12.642 | 33.238 |
| 65 | 12.843 | 32.862 |
| 70 | 12.999 | 32.381 |
| 75 | 12.314 | 30.396 |
| 80 | 11.298 | 28.106 |
| 85 | 9.958 | 24.600 |
| 90 | 8.510 | 20.752 |
| 95 | 8.630 | 20.101 |
| 100 | 7.929 | 17.883 |
# Set up figure
fig = plt.figure(figsize=(5,5))
ax = fig.add_subplot()
x = age_group.index
y1 = age_group['All']
y2 = age_group['4hr']
ax.plot(x, y1, label='All arrivals')
ax.plot(x, y2, label='4 Hour arrivals')
ax.set_xlabel('Age band (lower bound)')
ax.set_ylabel('Thrombolysis use (%)')
ax.legend()
plt.tight_layout()
plt.savefig('output/thrombolysis_use_by_age.jpg', dpi=300)
plt.show()
Onset known#
Get fractions for each onset type
counts = data.groupby('S1OnsetTimeType').count()['StrokeTeam']
fractions = counts/counts.sum() * 100
fractions = fractions.round(1)
fractions
S1OnsetTimeType
Best estimate    33.7
Not known        33.1
Precise          33.1
Name: StrokeTeam, dtype: float64
# All admissions
onset_known_all = data.groupby('S1OnsetTimeType').mean()['thrombolysis_given']
onset_known_all.rename('All', inplace=True)

# Admissions within 4 hours of arrival
onset_known_4hr = data_4hr.groupby('S1OnsetTimeType').mean()['thrombolysis_given']
onset_known_4hr.rename('4hr', inplace=True)

# Combine
onset_known = pd.concat([onset_known_all, onset_known_4hr], axis=1) * 100
onset_known = onset_known.round(1)

# Re-order
order = ['Not known', 'Best estimate', 'Precise']
onset_known = onset_known.loc[order]
onset_known
| All | 4hr | |
|---|---|---|
| S1OnsetTimeType | ||
| Not known | 0.4 | NaN |
| Best estimate | 6.3 | 14.0 |
| Precise | 28.8 | 39.0 |
Arrival by ambulance#
arrive_by_ambo = np.mean(data['S1ArriveByAmbulance'] == 'Yes') * 100
print (f'Percent arriving by ambulance: {arrive_by_ambo:0.1f}')
Percent arriving by ambulance: 81.4
# All admissions
ambulance_all = data.groupby('S1ArriveByAmbulance').mean()['thrombolysis_given']
ambulance_all.rename('All', inplace=True)

# Admissions within 4 hours of arrival
ambulance_4hr = data_4hr.groupby('S1ArriveByAmbulance').mean()['thrombolysis_given']
ambulance_4hr.rename('4hr', inplace=True)

# Combine
ambulance = pd.concat([ambulance_all, ambulance_4hr], axis=1) * 100
ambulance = ambulance.round(1)
ambulance
| All | 4hr | |
|---|---|---|
| S1ArriveByAmbulance | ||
| No | 3.8 | 21.4 |
| Yes | 13.7 | 30.3 |
Thrombolysis use by comorbidities#
Only examine effect of comorbidity on thrombolysis use of those arriving within 4 hours of known onset.
Analyse by comorbidity ‘Yes’ or ‘No’. Ignore ‘No but’.
comords = ['CongestiveHeartFailure', 'Hypertension', 'AtrialFibrillation',
           'Diabetes', 'StrokeTIA', 'AFAntiplatelet', 'AFAnticoagulent',
           'AFAnticoagulentVitK', 'AFAnticoagulentDOAC',
           'AFAnticoagulentHeparin']

# Loop through comorbidities and get results
results = []
for comord in comords:
    result = data_4hr.groupby(comord).mean()['thrombolysis_given']
    results.append({'No': result['No'] * 100,
                    'Yes': result['Yes'] * 100})

comord_df = pd.DataFrame(results, index=comords)
comord_df['Ratio'] = comord_df['Yes'] / comord_df['No']
comord_df = comord_df.round(3)
comord_df
| No | Yes | Ratio | |
|---|---|---|---|
| CongestiveHeartFailure | 29.709 | 26.081 | 0.878 |
| Hypertension | 30.331 | 28.826 | 0.950 |
| AtrialFibrillation | 32.034 | 19.931 | 0.622 |
| Diabetes | 30.066 | 27.241 | 0.906 |
| StrokeTIA | 32.151 | 22.506 | 0.700 |
| AFAntiplatelet | 18.455 | 28.757 | 1.558 |
| AFAnticoagulent | 34.253 | 8.976 | 0.262 |
| AFAnticoagulentVitK | 31.009 | 11.942 | 0.385 |
| AFAnticoagulentDOAC | 32.254 | 5.677 | 0.176 |
| AFAnticoagulentHeparin | 30.068 | 7.576 | 0.252 |
# Set up figure
fig = plt.figure(figsize=(8,5))
ax = fig.add_subplot()
x = comord_df.index
y = comord_df['Ratio']

ax.barh(x, y)
ax.set_xlabel(
    'Ratio of thrombolysis use\n(co-morbidity present / comorbidity absent)')
ax.set_ylabel('Comorbidity')
ax.grid(axis='x')

plt.tight_layout()
plt.savefig('output/thrombolysis_use_by_comorbidity.jpg', dpi=300)
plt.show()
Reasons for not giving thrombolysis#
Reasons given for not using thrombolysis (more than one may be ticked for each patient).
Only examine reasons for those arriving within 4 hours of known onset.
reasons = ['Haemorrhagic', 'TimeWindow', 'Comorbidity', 'Medication', 'Refusal',
           'Age', 'Improving', 'TooMildSevere', 'TimeUnknownWakeUp',
           'OtherMedical']

# Restrict data to non-thrombolysed patients
mask = data_4hr['thrombolysis_given'] == False
no_thromolysis_4hr = data_4hr[mask]
# Convert Yes/No in reasons to boolean
reasons_boolean = no_thromolysis_4hr[reasons] == 'Yes'
# Get average of 'Yes' values as percentage
reasons = reasons_boolean.mean() * 100
reasons = reasons.round(1)
# Sort by value
reasons.sort_values(ascending=True, inplace=True)

reasons
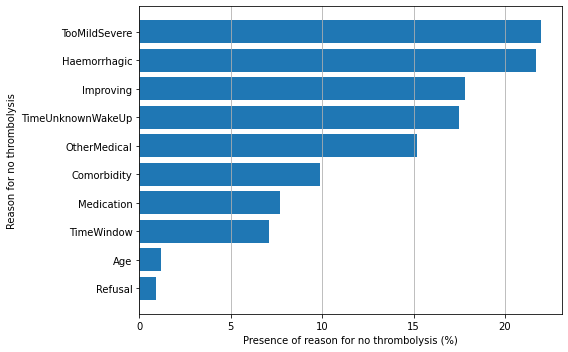
Refusal               0.9
Age                   1.2
TimeWindow            7.1
Medication            7.7
Comorbidity           9.9
OtherMedical         15.2
TimeUnknownWakeUp    17.5
Improving            17.8
Haemorrhagic         21.7
TooMildSevere        22.0
dtype: float64
# Set up figure
fig = plt.figure(figsize=(8,5))
ax = fig.add_subplot()
x = reasons.index
y = reasons.values

ax.barh(x, y)
ax.set_xlabel('Presence of reason for no thrombolysis (%)')
ax.set_ylabel('Reason for no thrombolysis')
ax.grid(axis='x')

plt.tight_layout()
plt.savefig('output/thrombolysis_non_use_reasons.jpg', dpi=300)
plt.show()
Observations#
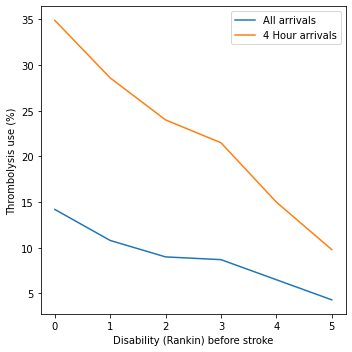
Disability before stroke: The higher the level of disability before stroke (as described by the modified Rankin Scale) the lower the use of thrombolysis. As a percentage of all out-of-hospital onset arrivals, thrombolysis use drops from 14.2% in those with no disability before stroke to 4.3% of those with a modified Rankin Scale of 5. As a percentage of out-of-hospital onset arrivals arriving within 4 hours of known stroke onset, thrombolysis use drops from 34.9% in those with no disability before stroke to 9.8% of those with a modified Rankin Scale of 5.
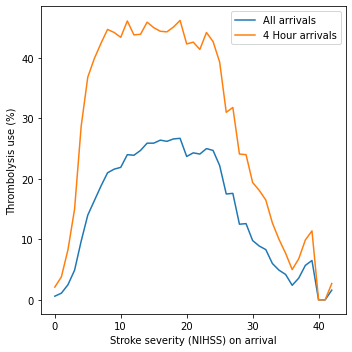
Stroke severity: The use of thrombolysis varies very significantly with stroke severity (NIHSS) on arrival (Figure 2). Thrombolysis use is very low at extreme NIHSS, withy a plateau of use between NIHSS of approximately 6 to 25.
Gender: There is a small association between gender on use of thrombolysis. 12.3% of all male arrivals receive thrombolysis, compared with 11.3% for females. Of those arriving within 4 hours of known stroke onset 30.8% of all male arrivals receive thrombolysis, compared with 28.2% for females.
Ethnicity: There is some association between ethnicity on thrombolysis use in all arrivals, with black people having the lowest use of thrombolysis (10.2% vs 11.6% - 12.1% for white, asian and mixed race people), but little variation in use of thrombolysis in those arriving within 4 hours of known stroke onset, suggesting the cause of lower use of thrombolysis is likely to be the lower proportion of black people arriving at hospital within 4 hours of known stroke onset.
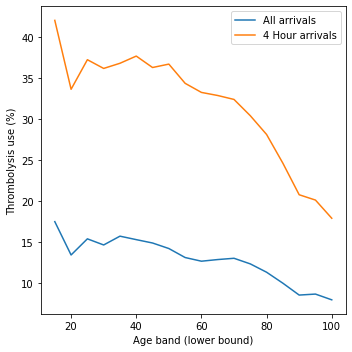
Age: Thrombolysis use declines with age. For ages 25-55, thrombolysis use is about 15% of all arrivals and 35% of those arriving within 4 hours of known stroke onset. Above this age there is a decline in use, for example in the age band 85-89, use is about 10% of all arrivals and 25% of those arriving within 4 hours of known stroke onset
Knowledge of time of onset: Knowledge of onset is split almost evenly (33% to 34% each) for ‘not known’, ‘best estimate’, and ‘precise’. Type of knowledge of stroke onset shoes a significant association with use of thrombolysis. Of those arriving within 4 hours of known onset, 39.0% receive thrombolysis if the time is recorded as being known precisely, compared with 14.0% receiving thrombolysis if the time is a best estimate.
Arrival by ambulance: 8.4% of arrivals are by ambulance. There is a significant effect arrival model on use of thrombolysis. For all arrivals, use of thrombolysis is 13.7% for arrivals by ambulance, and 3.8% for other arrivals.
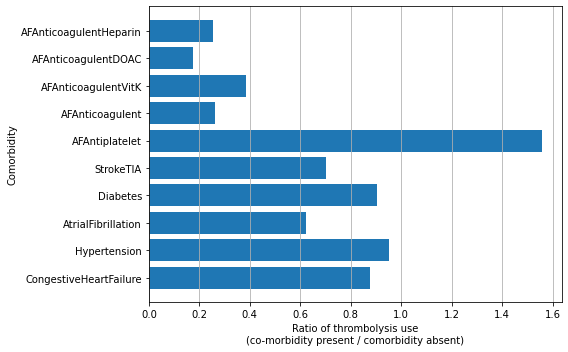
Presence of co-morbidities: The presence or absence of co-co-morbidities can be a strong indicator of the use of thrombolysis. For example those on anticoagulant therapies receive thrombolysis less than those who do not, but those on anti-platelet therapies receive it more.
Stated reasons for not giving thrombolysis:: Haemorrhagic stroke or a stroke that is too mild/sever are the most common causes (each present in 22% of those not treated). An improving condition is given as the reason for no treatment in 17% of non-treated patients. It is noteworthy that patient refusal is given as a reason for non-treatment in only 0.9% of untreated patients