Scientific Summary
Contents
Scientific Summary#
Background#
Stroke#
Stroke is a medical condition where blood flow to an area of the brain has been interrupted, causing cell death. Stroke may be broadly categorised into two types: ischaemic, due to an arterial blockage, and haemorrhagic, due to bleeding. Stroke is a major cause of adult long-term disability and is a major burden on healthcare services. It was estimated that in 2010, there were 5.9 million deaths and 33 million stroke survivors worldwide. Eighty five thousand people are hospitalized with stroke each year in England, Wales and Northern Ireland. Over the last 25 years stroke was the leading cause of lost disability-adjusted life years, which combine mortality and disability burdens.
Intravenous Thrombolysis (IVT)#
Intravenous thrombolysis (IVT) is a form of ‘clot-busting’ therapy developed to treat ischaemic stroke by removing or reducing the blood clot impairing blood flow in the brain. For ischaemic strokes, IVT is an effective treatment for the management of acute stroke if given soon (within 4 hours) after stroke onset, and is recommended for use in many parts of the world including Europe.
Based on expert clinical opinion, the Sentinel Stroke National Audit Programme Report, the NHS long term plan, and the specification of the Integrated Stroke Delivery Networks all provide a target of 20% of stroke patients receiving thrombolysis. Currently 11%-12% of patients in England and Wales receive thrombolysis, with significant inter-hospital variability (per-hospital thrombolysis use ranges from 2% to 25%).
Use of thrombolysis is therefore lower than target, and highly variable between hospitals.
Clinical audit#
NHS England describes clinical audit in the following way:
“Clinical audit is a way to find out if healthcare is being provided in line with standards and lets care providers and patients know where their service is doing well, and where there could be improvements. The aim is to allow quality improvement to take place where it will be most helpful and will improve outcomes for patients…”
The national audit covering stroke is the Sentinel Stroke National Audit Programme (SSNAP). SSNAP collects longitudinal data on the processes and outcomes of stroke care up to 6 months post-stroke for more than 90% of stroke admissions to acute hospitals in England, Wales and Northern Ireland. Every year data from approximately 85 000 patients are collected. SSNAP publishes quarterly and yearly analysis of results.
Objectives#
We seek to enhance the national stroke audit by providing further analysis of the thrombolysis pathway at each hospital, identifying areas which would most improve the clinical benefit of thrombolysis, allowing quality improvement to focus down on the most influential aspect.
Modelling of the stroke thrombolysis pathway#
We model three aspects of the thrombolysis pathway:
Pathway speed: what would be the effect of changing time from arrival to scan, or time from scan to treatment?
Determination of stroke onset time: what would be the effect of changing the proportion of patients with determined stroke onset time?
Clinical decision making: what would be the effect of treating patients according to decisions made at a benchmark set of hospitals?
Qualitative research#
In addition to the modelling work, the project had a qualitative research arm, with the objective of understanding clinicians’ attitudes to use of modelling and machine learning applied to the national stroke audit.
Methods#
Data#
Data was retrieved for 246,676 emergency stroke admissions to acute stroke teams in England and Wales between 2016 and 2018 (three full years). Data used is for units which have at least 300 emergency stroke admissions with at least 10 patients receiving thrombolysis in the three years.
Modelling clinical-decision making#
We modelled clinical decision making, whether a patient is predicted to receive thrombolysis or not, by using machine-learning methods. Machine learning methods investigated were logistic regression, random forests, and neural nets. All models were constructed in Python.
Modelling the stroke pathway#
We modelled the stroke pathway using Monte-Carlo simulation, sampling process times from distributions mimicking process speed at each hospital. The model was constructed in Python.
Availability of model code#
All code used in the project is available at https://samuel-book.github.io/samuel-1/
Qualitative research#
During the project we undertook interviews with groups and single clinicians. These were both face-to-face and via video. Due to Covid-19, interviews moved to entirely being remote during the project.
During the interviews, we collected data about physicians’ backgrounds, their attitudes to thrombolysis and their understanding of variance, their perspectives on machine learning, and potential loci for the implementation of machine learning feedback (within and beyond SSNAP), established the physicians’ views on possible unintended consequences, which may result from changing the acute stroke pathway, and potential means of mitigation.
Results#
General descriptive statistics#
94.7% of patients have an out-of-hospital stroke onset.
11.8% of all out-of-hospital stroke onset arrivals receive thrombolysis.
67% of all patients have a determined stroke time of onset, 60% of whom arrive within 4 hours of known stroke onset. 40% of all arrivals arrive within 4 hours of known stroke onset.
Of those out-of-hospital onset patients arriving within 4 hours of known stroke onset:
The average onset-to-arrival time is 111 minutes
95% receive a scan within 4 hours of arrival, with an average arrival-to-scan time of 43 minutes.
30% of those who receive a scan within 4 hours of known stroke onset receive thrombolysis.
The average scan-to-needle time is 40 minutes, the average arrival-to-needle time is 63 minutes, and the average onset-to-needle time is 158 minutes.
Inter-hospital variation#
Thrombolysis use varies from 1.5% to 24.3% of all patients, and 7.3% to 49.7% of patients arriving within 4 hours of known stroke onset.
The proportion of determined stroke onsets ranges from 34% to 99%.
The proportion of patients arriving within 4 hours of known stroke onset ranges from 22% to 56%.
The proportion of patients scanned within 4 hours of arrival ranges from 85% to 100%.
Average arrival-to-scan time (for those arriving within 4 hours of known stroke onset and scanned within 4 hours of arrival) ranges from 19 to 93 minutes.
Average arrival-to-needle time varies from 26 to 111 minutes.
The proportion of patients aged 80+ varies from 29% to 58%.
The average NIHSS (stroke severity) ranges from 6.1 to 11.7.
Effect of time and day and day of week on use of thrombolysis#
Nationally, there is a significant fall in use of thrombolysis for arrivals between 3am and 6am (with about 6% receiving thrombolysis, compared with 11% to 13% in other periods during the day), but the number of arrivals in this period is only about 3% of all arrivals.
Nationally there is a small effect of day of week, with thrombolysis use ranging from 11.2% to 12.6% by day of week (increasing Monday through to Sunday).
Machine learning for clinical decision making#
Machine learning, predicting use of thrombolysis, was performed on the 40% of patients arriving within 4 hours of known stroke onset; these are the patients with a chance of receiving thrombolysis.
Machine learning performance#
Machine learning accuracy was assessed using stratified k-fold cross-validation.
Model* |
Accuracy (%) |
ROC-AUC |
Max Sens=Spec (%) [1] |
|---|---|---|---|
Logistic regression single model |
83.2 |
0.904 |
82.0 |
Logistic regression hospital-level models |
80.6 |
0.870 |
78.9 |
Random forest single model |
84.6 |
0.914 |
83.7 |
Random forest hospital-level models |
84.3 |
0.906 |
83.2 |
Fully-connected neural net single model |
84.4 |
0.913 |
83.3 |
1D Embedding neural net single model |
85.5 |
0.921 |
84.5 |
* Single model fits use one-hot encoding for hospitals. Hospital-level models fit a model to each hospital independently. Embedding neural nets encode hospital id, pathway data, and clinical data into a single value vector each.
[1] The maximum value where sensitivity matches specificity.
Machine learning models ranged from 83% to 86% accuracy depending on model type. The model with the highest accuracy, by a small margin, was a neural network using three embedding layers for hospital ID, clinical features of the patients, and pathway timings.
There is high agreement between model types. Logistic regression (single fit), random forests (single fit), and neural networks (single fit, 1D embedding) agree classification on 87% of patients. Neural networks and random forests agree on 93% of patients.
There is generally higher agreement between model types (87% to 93% for any pairwise comparison), than between models and reality (83% to 86% accuracy for the same model types).
Combining outputs of the three model types into one combined model (an ensemble model) did not improve accuracy.
Accuracy of models increased with training set size up to about 30k training set examples.
All random forest and neural network models were well calibrated, meaning that 9 out of 10 people with a predicted 90% probability of receiving thrombolysis would receive thrombolysis.
Comparing decisions between hospitals#
For most modelling (e.g. inclusion in stroke pathway model) we have chosen to use hospital-level random forests models. Though accuracy is a little lower than the best models, these models are easier for people to understand and have strong hospital independence. When comparing predicted decisions between hospitals:
It is easier to find majority agreement on who not to thrombolyse than who to thrombolyse. 77.5% of all patients have a treatment decision that is agreed by 80% hospitals. Of those who were not given thrombolysis, 84.6% had agreement by 80% hospitals. Of those who were given thrombolysis, 60.4% had agreement by 80% hospitals.
A comparison of a hospital’s likelihood to give thrombolysis may be made by passing the a standard 10k patient cohort set through all hospitals. This evaluates likelihood to give thrombolysis independently from hospitals own local patient populations.
A benchmark set of hospitals was created by passing the same 10k patient cohort set through all hospitals, and selecting the 30 hospitals with the highest thrombolysis use. If all thrombolysis decisions were made by a majority vote of these hospitals then thrombolysis use (in those arriving within 4 hours of known stroke onset) would be expected to increase from 29.5% to 36.9%. Figure 5 shows a comparison of current thrombolysis rate at each hospital and the predicted thrombolysis rate if decisions were made according to the majority vote of the 30 benchmark hospitals.
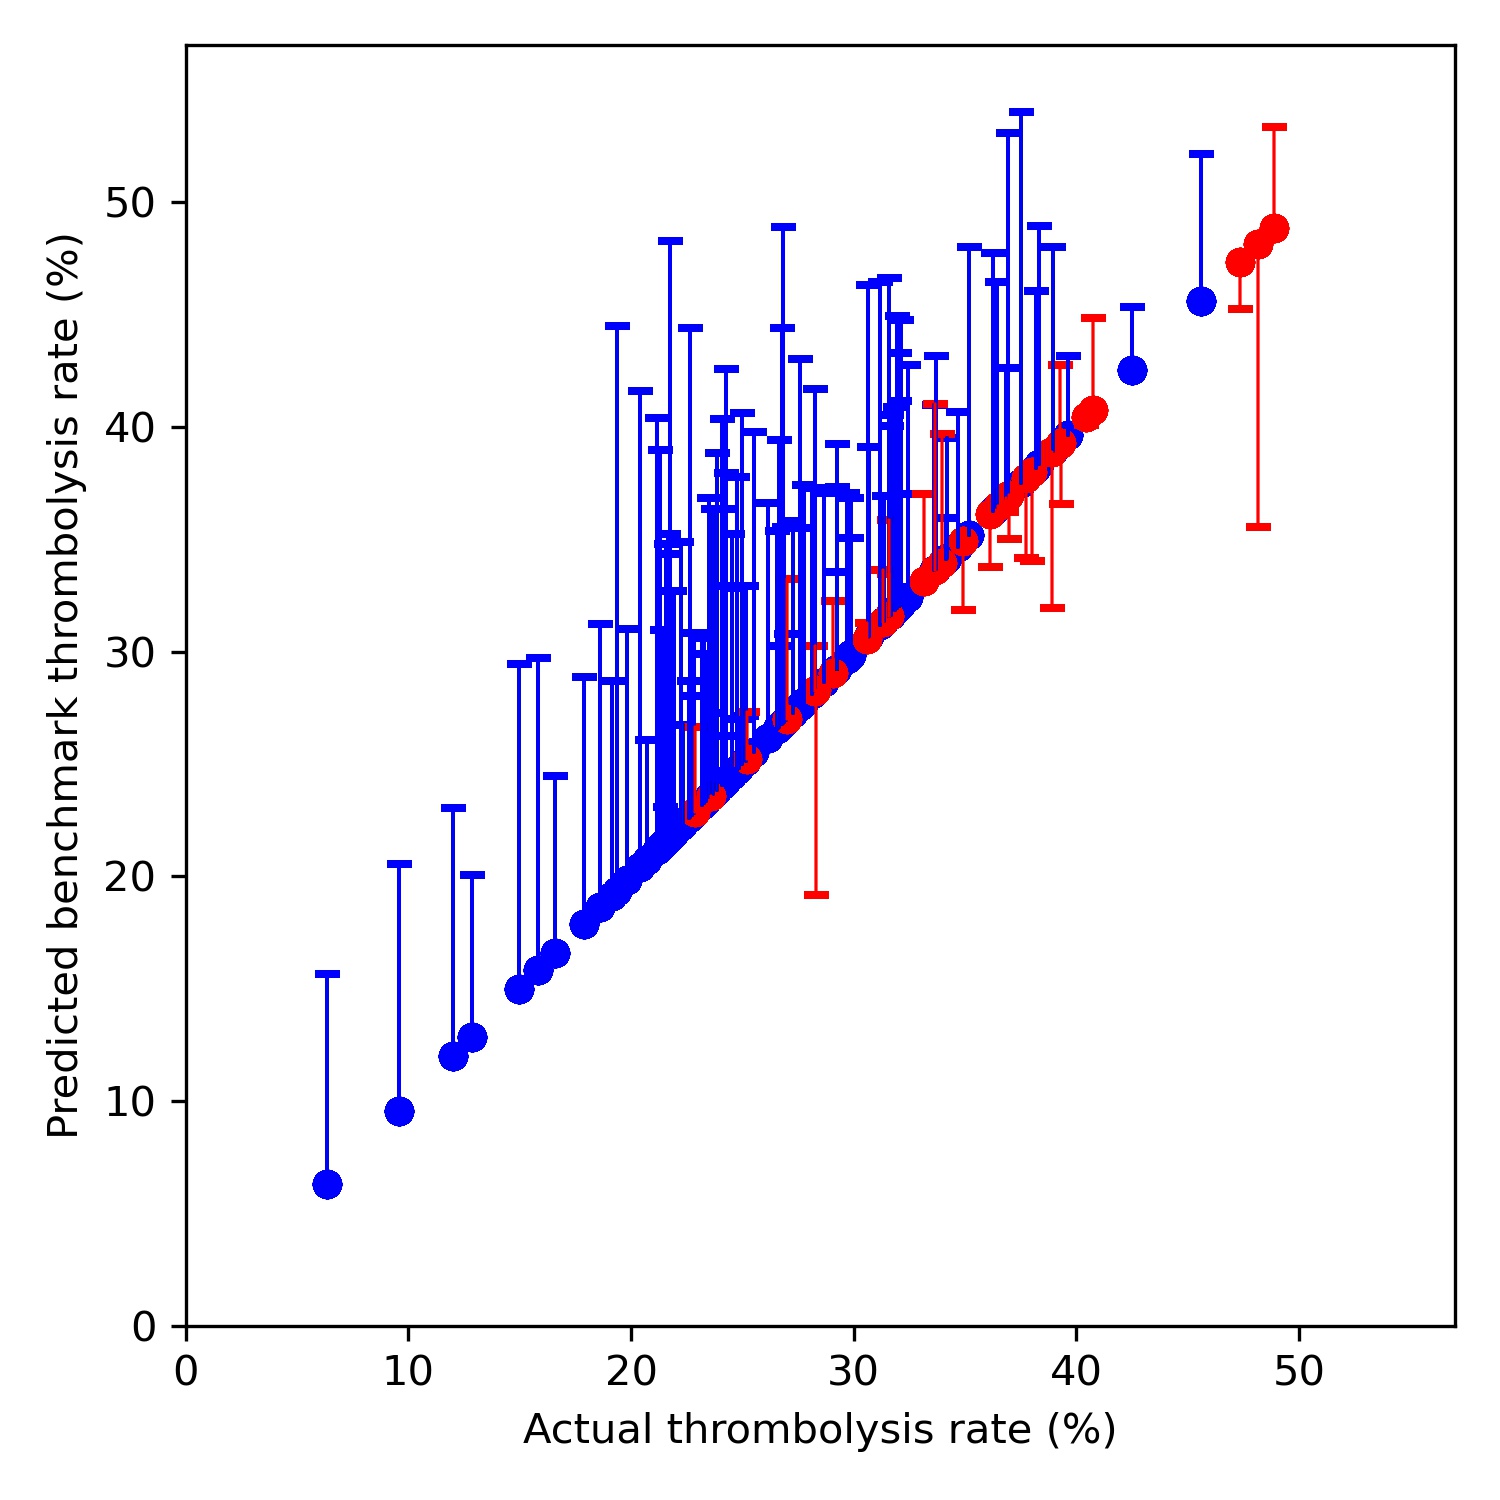
Fig. 5 Comparison of current thrombolysis rate at each hospital and the predicted thrombolysis rate if decisions were made according to the majority vote of the 30 benchmark hospitals. Thrombolysis rate is predicted for patients arriving within 4 hours of known stroke onset. The solid circle shows the current thrombolysis use, and the bar shows the thrombolysis use predicted by majority vote of the benchmark hospitals. The red points are those hospitals that are in the top 30 of hospitals when cohort thrombolysis use is predicted, with other hospitals coloured blue.#
Models may be used to identify two types of patients (and patient vignettes may be constructed to illustrate particular types of patients):
Patients where the model has high confidence in prediction, but were not treated as expected (e.g. a patient who appears to have high suitability for thrombolysis, but did not receive it).
Patients which were treated according to the prediction of the hospital model, but where the majority of the benchmark hospitals would have treated that patient differently. Figure 6 shows an example of patient clinical embedding as a 2D vector. Haemorrhagic stroke patients are in red, and non-haemorrhagic stroke patients in blue.
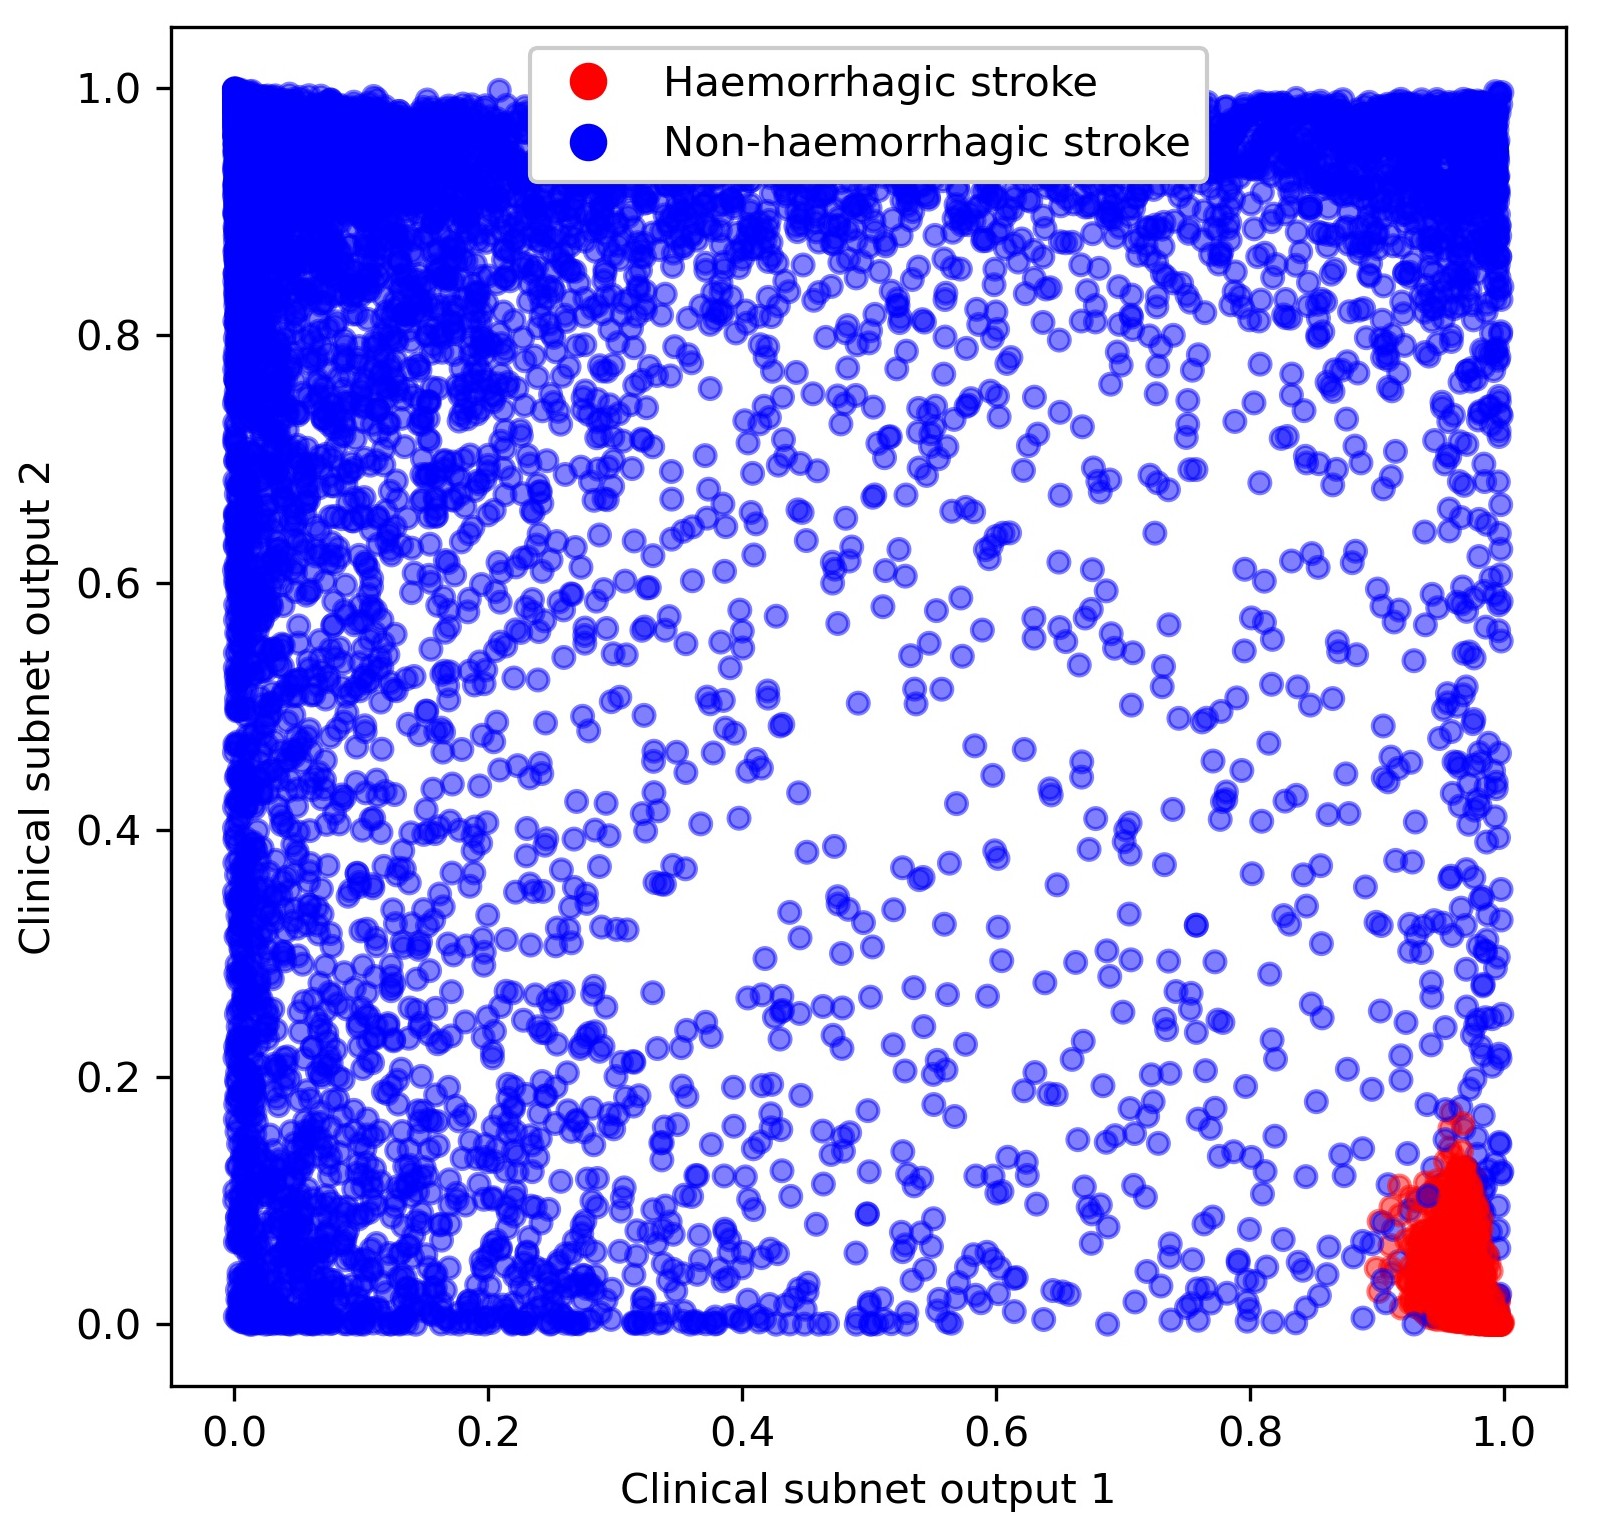
Fig. 6 Clinical subnet embedding output marking of those patients with a haemorrhagic stroke (red) as opposed to a non-haemorrhagic stroke (blue).#
Hospitals may be grouped by comparison of what proportion of patients would be expected to have the same thrombolysis decision.
Using embedding neural networks, similar patients (e.g. haemorrhagic stroke patients, or patients with severe stroke) are located close together in embedding space. Patient embedding may also be use to rank patients in order of suitability for thrombolysis (by consensus across all hospitals). Similarly hospital embedding may be used to rank hospitals by likelihood to use thrombolysis, independent of patient and pathway characteristics.
Compared with patients where 70% of units would give thrombolysis, those contentious patients, where 30-70% of units would give thrombolysis:
Are more likely to have an estimated, rather than precise, onset time
Arrive later
Have longer arrival to scan times
Have a lower NIHSS score
Have greater disability prior to the stroke
Are older
Do not have facial palsy
Do not have visual field deficits
Have atrial fibrillation
Pathway simulation#
The model is used to examine the effect, at each hospital and nationally, of making three key changes (alone or in combination) to the stroke pathway:
Speed: Sets 95% of patients having a scan within 4 hours of arrival, and all patients have 15 minutes arrival to scan and 15 minutes scan to needle.
Onset-known: Sets the proportion of patients with a known onset time of stroke to the national upper quartile if currently less than the national upper quartile (leave any greater than the upper national quartile at their current level).
Benchmark: The benchmark thrombolysis rate takes the likelihood to give thrombolysis for patients scanned within 4 hours of onset from the majority vote of the 30 hospitals with the highest predicted thrombolysis use in a standard 10k cohort set of patients. These are from Random Forests models.
The results of making these changes were:
The model predicts current thrombolysis use with high accuracy (Figure 7, R-squared of 0.979, mean absolute difference in thrombolysis use of 0.5 percentage points).
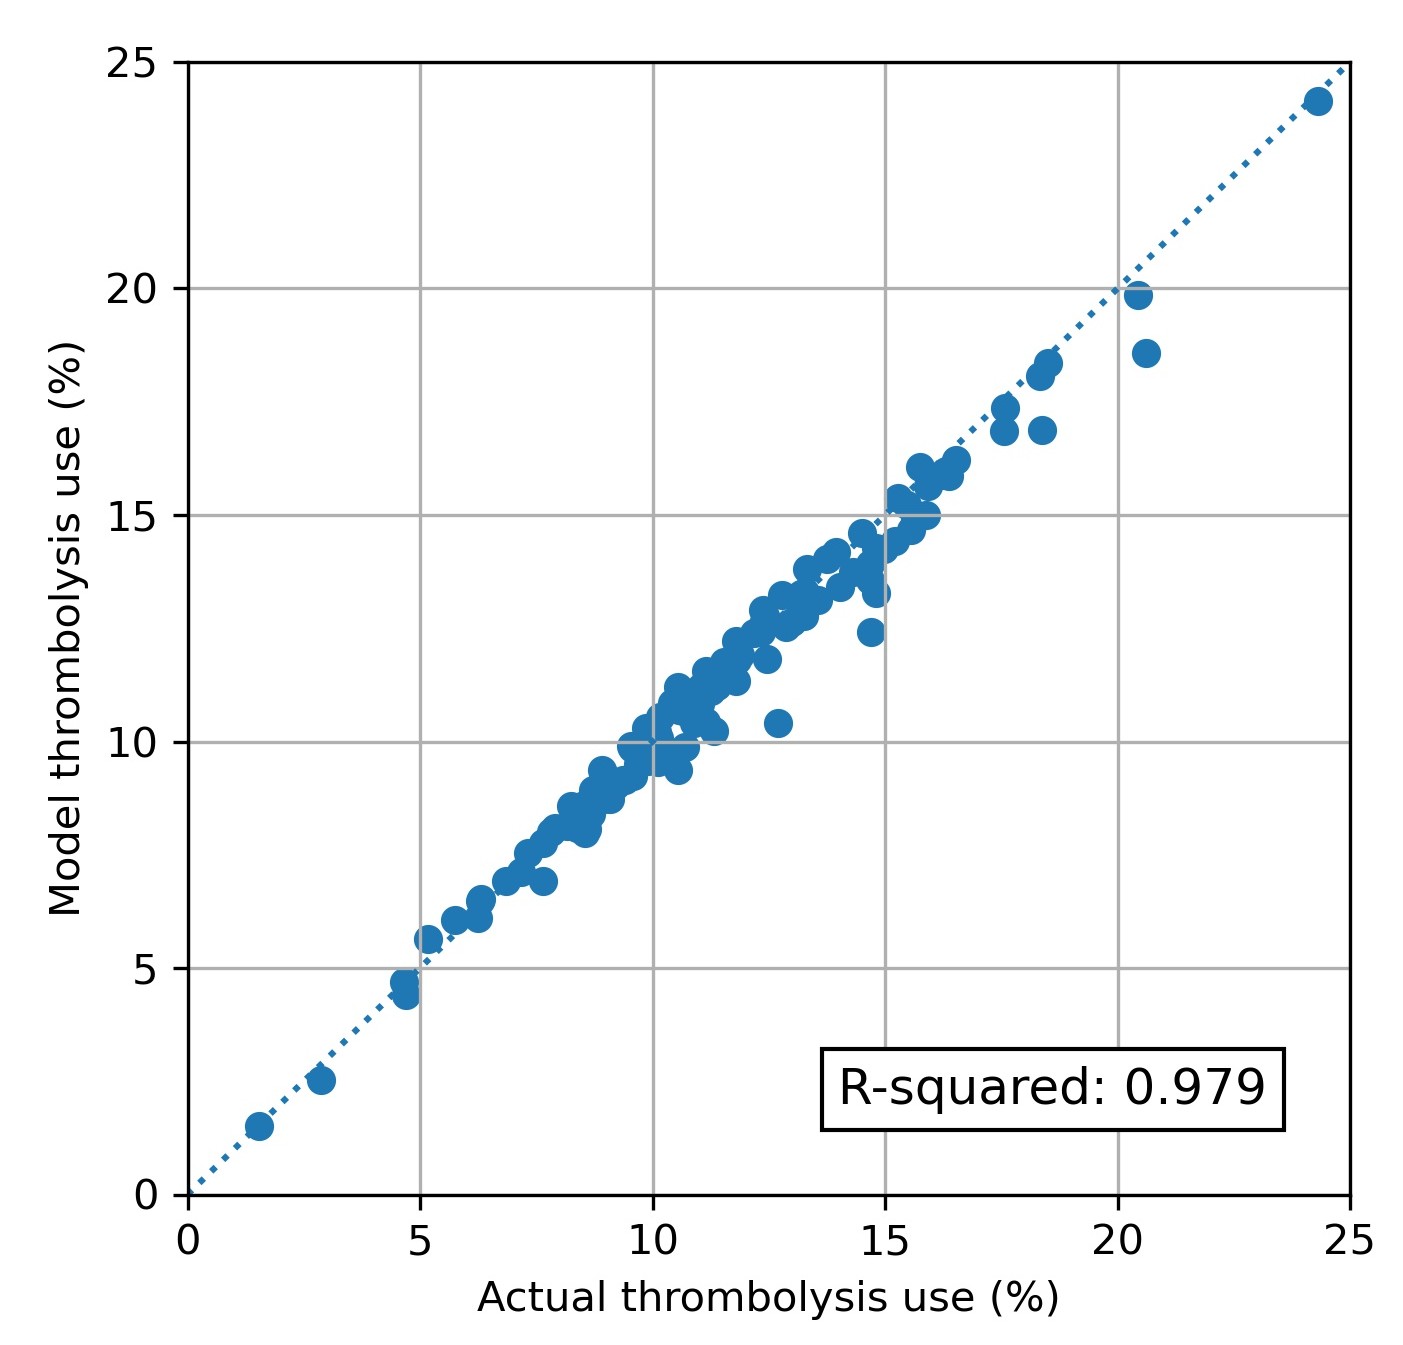
Fig. 7 Modelled vs actual thrombolysis use at each hospital.#
Combining the three changes suggests that thrombolysis use could potentially be increased from 11.6% to 18.3% of all emergency admissions, and the clinical benefit increased from 9.4 to 17.6 additional good outcomes per 1,000 admissions. The average drivers in improvement in thrombolysis use are benchmark decisions > determining stroke onset > speed, while the average drivers in improvement in outcomes are speed > benchmark decisions > determining stroke onset.
Figure 8 shows the net effect of changes at all hospitals:
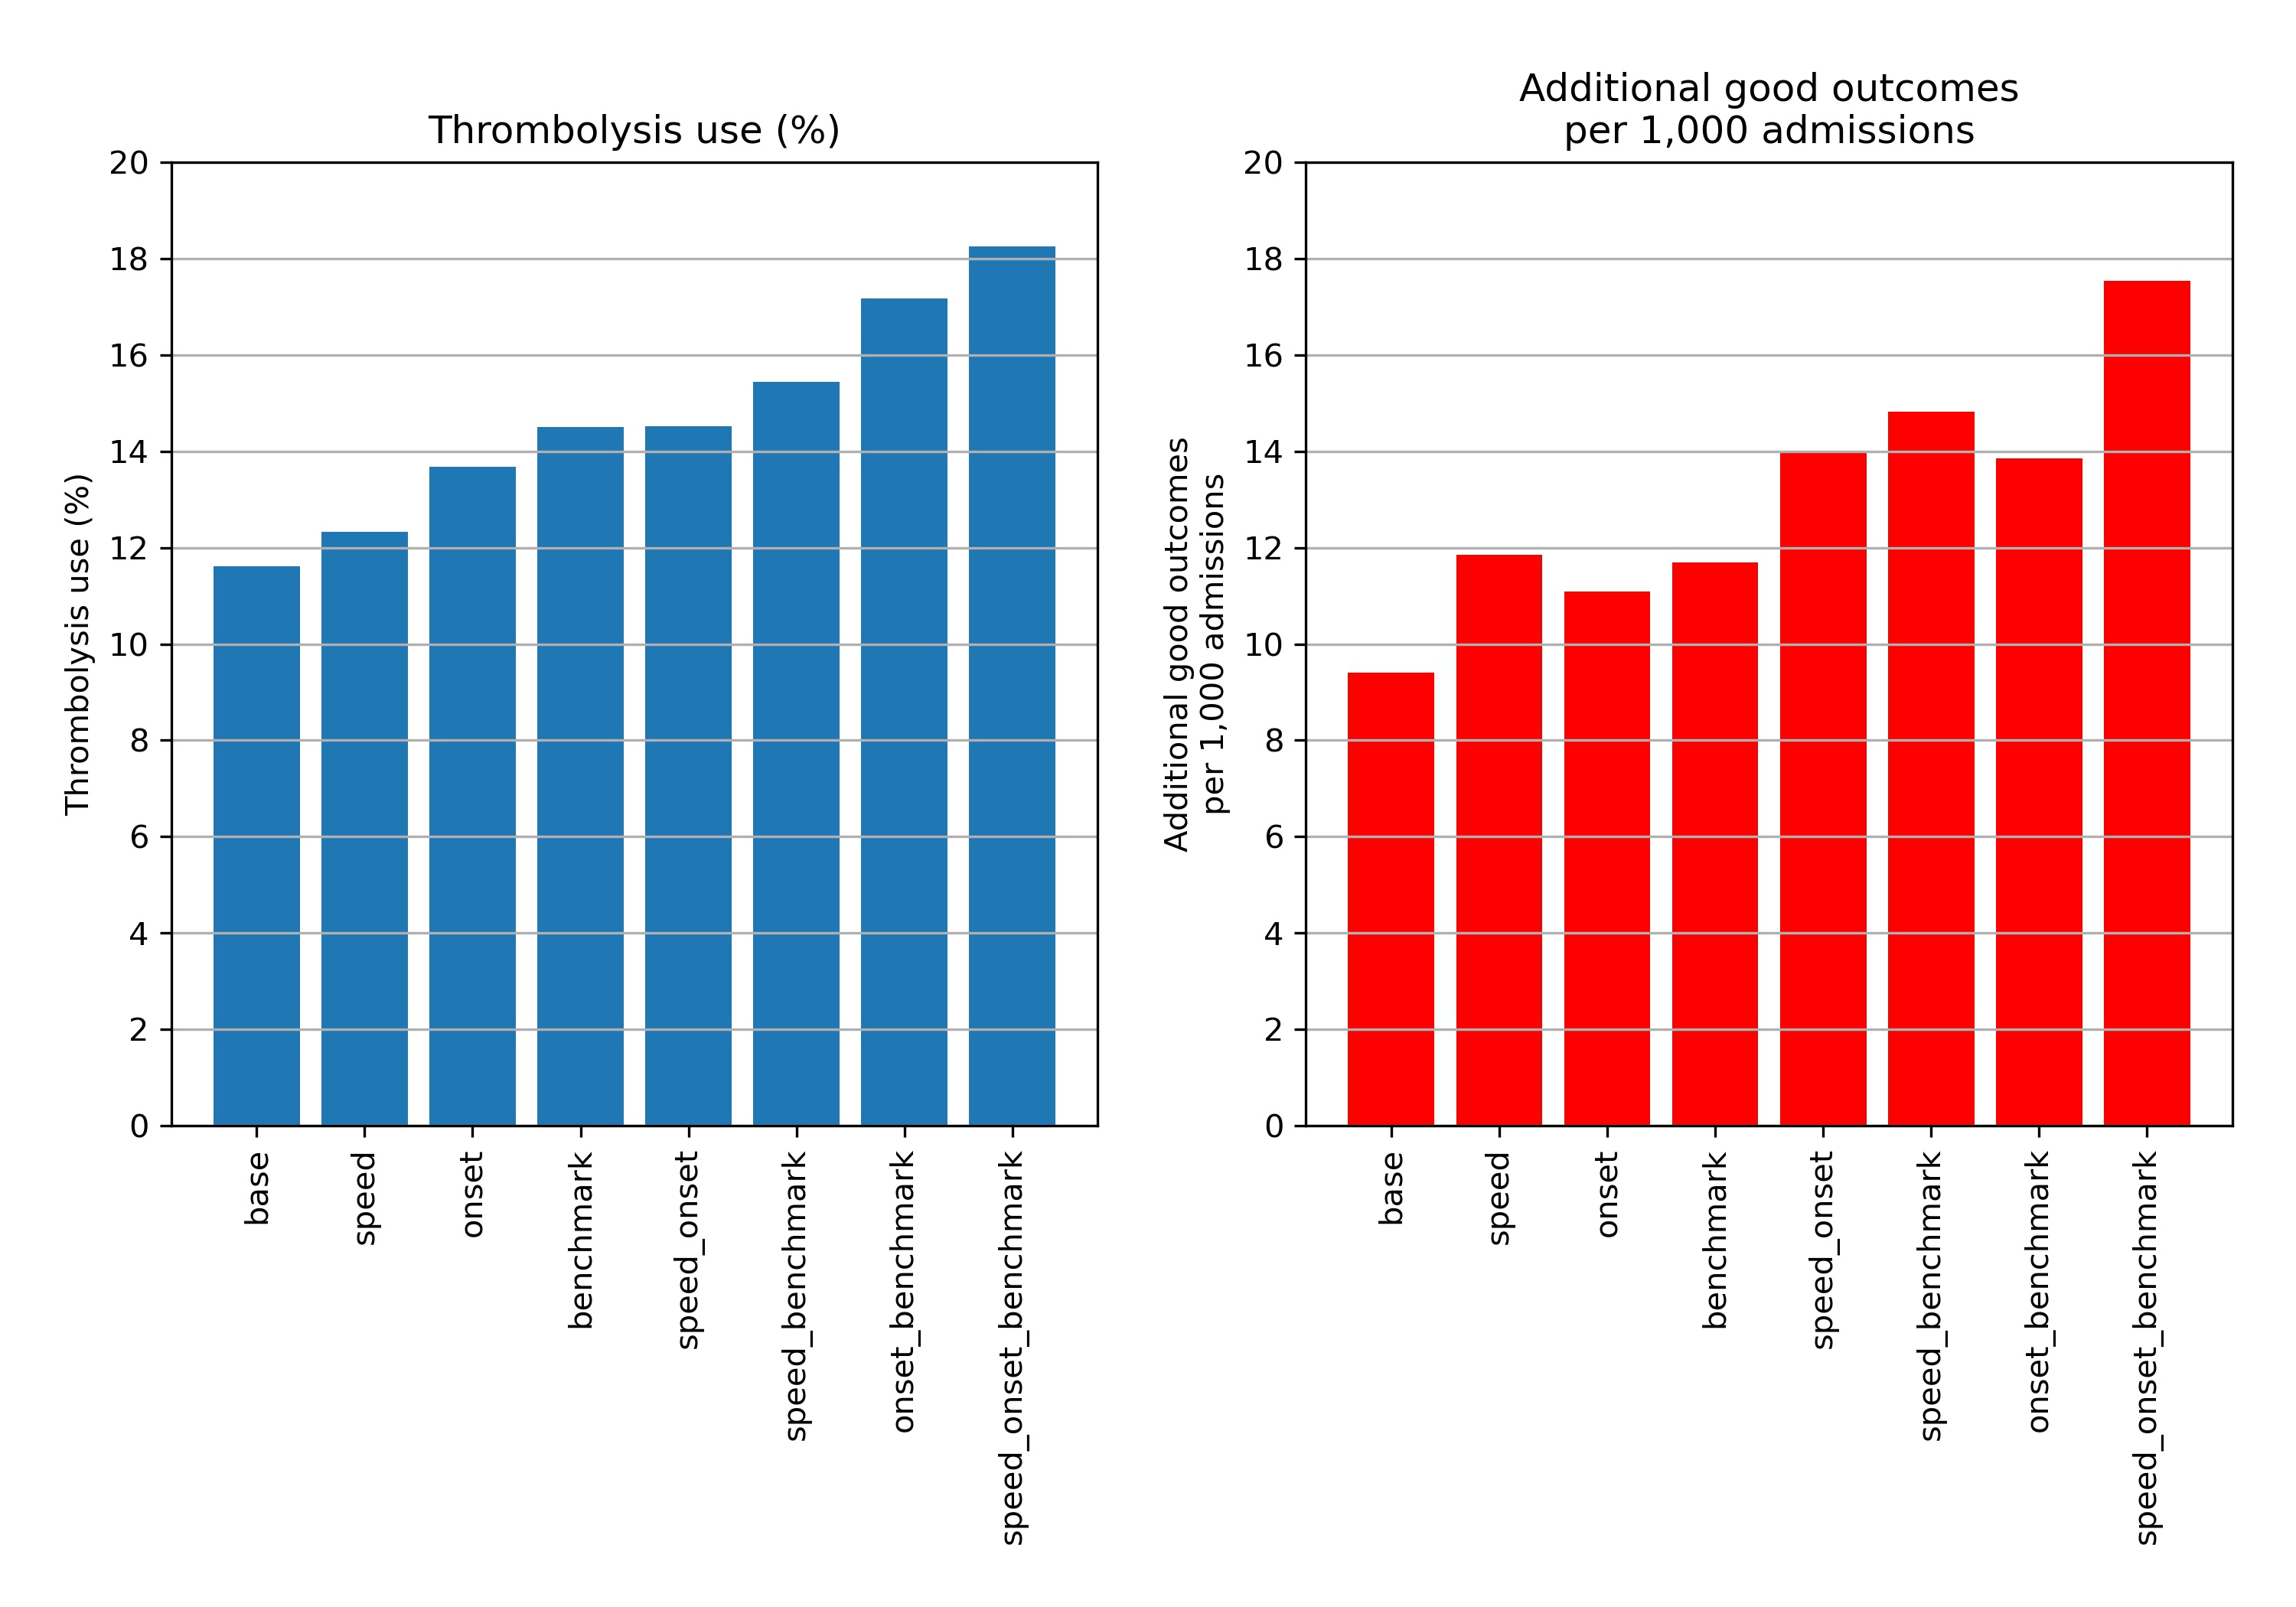
Fig. 8 Net national changes in thrombolysis use (left) or clinical benefit (right) by changing aspects of the stroke pathway (speed of stoke pathway, determining stroke onset time, and using benchmark decisions). Results show effects across all 132 English stroke units, with averages weighted by admission numbers.#
Figure 9 shows the distribution of use of, and benefit from, thrombolysis before and after all the modelled changes. It is noteworthy that there is still significant variation between hospitals, but that the distributions have been shifted.
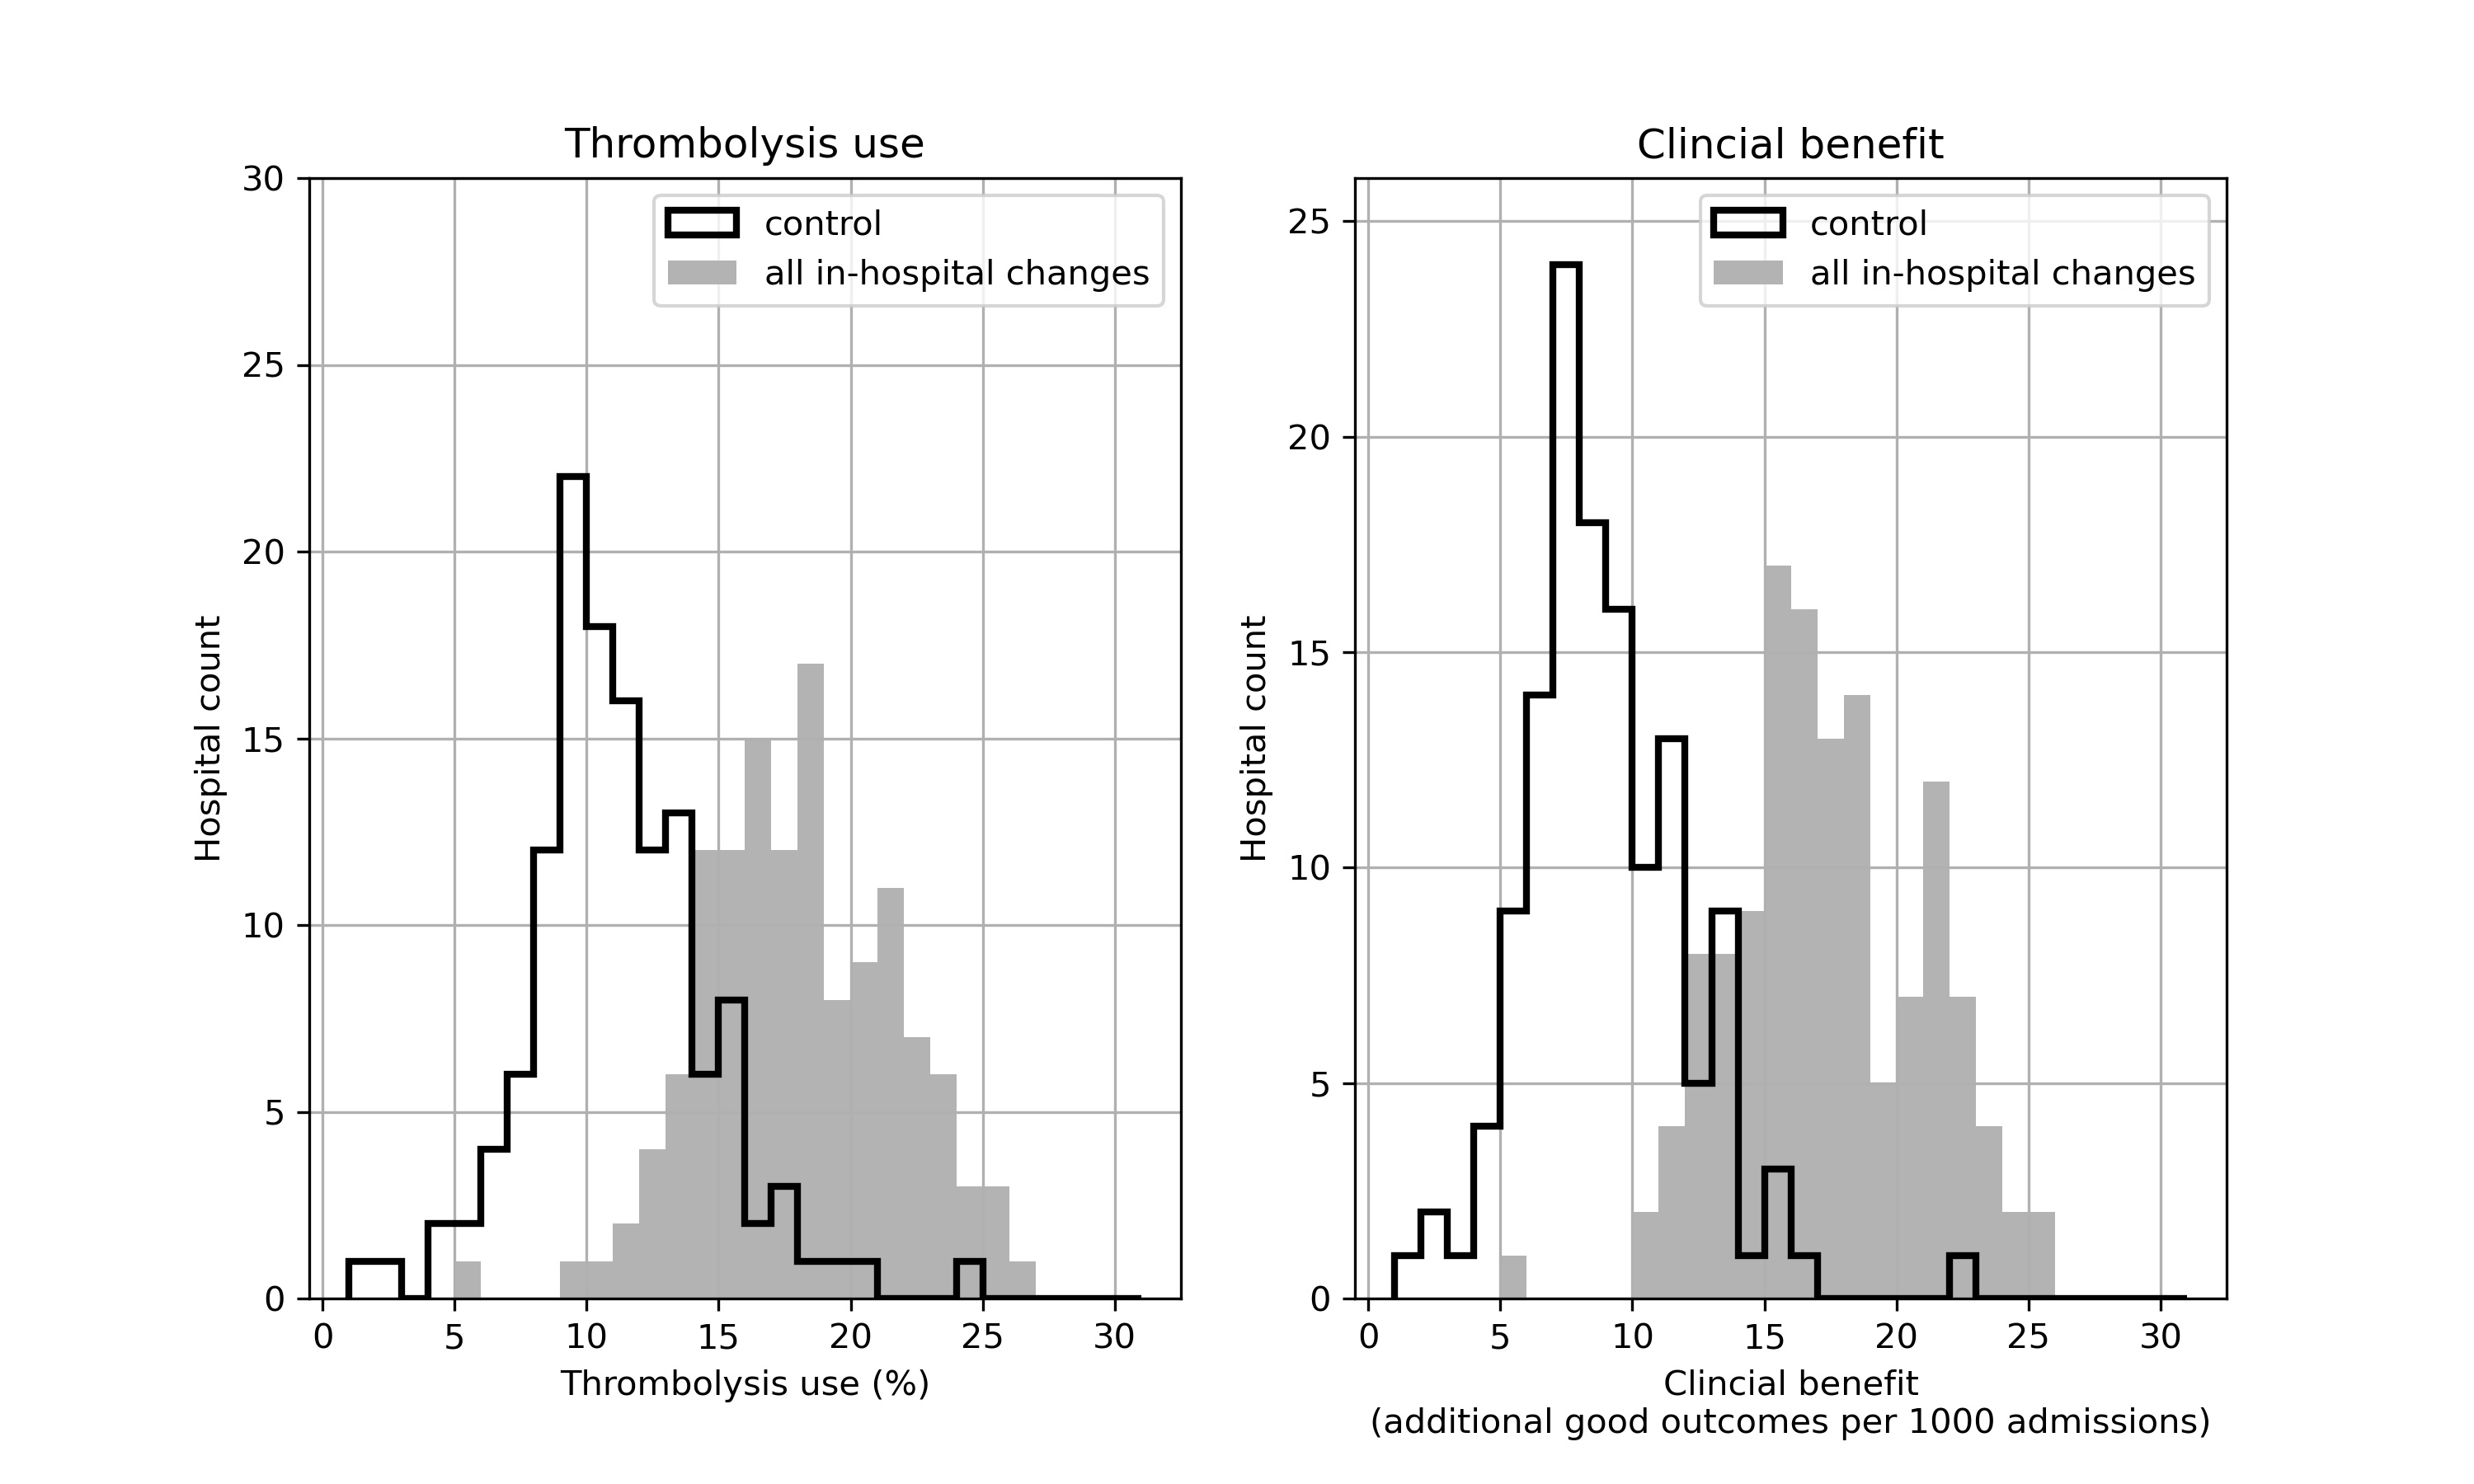
Fig. 9 Histograms for changes in distribution in thrombolysis use (left) or clinical benefit (right) by combining changes to speed (95% of patients have 15 minutes arrival-to-scan and 15 minute scan-to-treatment, with other patients not being scanned within 4 hours of arrival), determining stroke onset time (to the national upper quartile if currently lower), and using benchmark decisions. The unshaded histogram shows the current base-case use of, and benefit from, thrombolysis, and the grey shaded histogram shows the predictions with all changes.#
The model identifies the changes that make most difference at each hospital, and may be used to provide a target use of thrombolysis that is tailored to each hospital.
We also used the modelling to explore the most significant causes of inter-hospital variation in thrombolysis use (a subtly different question from asking about what will improve thrombolysis use most). The key findings were:
About half of the variance in current thrombolysis use is due to differences in local patient populations, and about half is due to differences within hospitals (pathway speed, determination of stroke onset time, decisions to thrombolyse or not).
Within the hospitals, the largest contributor to inter-hospital differences in thrombolysis use is differences in decision making around thrombolysis, then speed, then determination of stroke onset time.
If all hospitals treated a standard set of patients, reflecting national averages in patient population characteristics, hospitals that currently have a lower thrombolysis rate would tend to give more thrombolysis, and those with higher thrombolysis rates would tend to give less thrombolysis. But this explains only about half of the differences between low and high thrombolysing units.
Qualitative research#
Qualitative research demonstrated a varying openness to machine learning and modelling techniques.
Broadly, those units with higher thrombolysis use engaged more positively with the research, and those with lower thrombolysis use were more cautious.
Clinicians wanted to see the machine learning models expanded to predict probability of good outcome and adverse effects of thrombolysis.
Despite this being a small study physicians engaged with the machine learning process and outcomes, suggesting ways in which the outputs could be modified for feedback to stroke centres, and utilised to inform thrombolytic decision-making.
Limitations#
Models may only be built using data available in SSNAP. Not all factors affecting use of thrombolysis are contained in SSNAP data; the model therefore provides information on patterns of thrombolysis use in hospitals, but is not suitable for, or intended for, a decision aid to thrombolysis.
Conclusion#
Using modelling and machine learning we identify potential for reaching close to the 20% target of thrombolysis use, and doubling clinical benefit from thrombolysis.
Implications for healthcare#
Realistically achievable thrombolysis use depends on local patient populations, so a universal target of 20% across all hospitals may over-estimate what is achievable at some hospitals, while under-estimating what is achievable at other hospitals. Local agreed targets may be more appropriate.
The tools develop have the potential to add further depth of analysis to the national stroke audit outputs, and may be transferable to other national clinical audits.
Recommendations for further research#
Expand machine learning to predict probability of good outcome, and probability of adverse effects of thrombolysis.
Conduct further qualitative research with a more targeted approach to lower thrombolysis units, or groups of units (such as Integrated Stroke Delivery Networks) that include units with lower thrombolysis use.
Expand outputs of models to incorporate health economic evaluation of changes, to demonstrate benefits in health economic terms such as Quality Adjusted Life Years. This allows exploration the cost-effectiveness of making organisational changes to the care pathway.
Include organisational features (from the national stroke audit organisational audit) in machine learning models.
Develop more methods to explain machine learning models (and the biases that have been learned), so that people could see what was driving model overall and individual predictions. For example, incorporate Shapley values in model outputs. Include design of a web portal for drilling down into hospital models in more detail.
Funding#
This project was funded by the National Institute for Health Research (NIHR) HS&DR programme (Reference Number: 17/99/89) and will be published in full in Health Services and Delivery Research Journal; Vol. XX, No. XX. See the NIHR Journals Library website for further project information.