Find similar patients who are treated differently within the same hospital
Contents
Find similar patients who are treated differently within the same hospital#
Aims#
Investigate the number of misclassifications within a hospital
Define a similarity measure using the decision tree structure of a random forest classifier
For patients with a predicted outcome different to their true outcome, find similar patients that were treated differently
Code#
Import libraries#
import os
import json
import pickle as pkl
import pandas as pd
import numpy as np
import matplotlib.pyplot as plt
import matplotlib.ticker as ticker
%matplotlib inline

import sklearn as sk
from sklearn.ensemble import RandomForestClassifier
from sklearn.tree import DecisionTreeClassifier

# Turn warnings off to keep notebook tidy
import warnings
warnings.filterwarnings("ignore")
Load pre-trained hospital models into dictionary hospital2model#
keys = hospitals
values = trained_classifier, threshold, patients, outcomes
Note: patients is a numpy array.
with open ('./models/trained_hospital_models_for _cohort.pkl', 'rb') as f:

    hospital2model = pkl.load(f)
Select a hospital for investigation#
hospital = list(hospital2model.keys())[1]
hospital
'TPFFP4410O'
Load test cohort and extract hospital patients#
cohort = pd.read_csv('../data/10k_training_test/cohort_10000_test.csv')

test_patients_df = cohort.loc[cohort['StrokeTeam']==hospital]
test_patients_df.head(5)
| StrokeTeam | S1AgeOnArrival | S1OnsetToArrival_min | S2RankinBeforeStroke | Loc | LocQuestions | LocCommands | BestGaze | Visual | FacialPalsy | ... | S2NewAFDiagnosis_Yes | S2NewAFDiagnosis_missing | S2StrokeType_Infarction | S2StrokeType_Primary Intracerebral Haemorrhage | S2StrokeType_missing | S2TIAInLastMonth_No | S2TIAInLastMonth_No but | S2TIAInLastMonth_Yes | S2TIAInLastMonth_missing | S2Thrombolysis | |
|---|---|---|---|---|---|---|---|---|---|---|---|---|---|---|---|---|---|---|---|---|---|
| 105 | TPFFP4410O | 72.5 | 68.0 | 2 | 2 | 2.0 | 2.0 | 0.0 | 2.0 | 2.0 | ... | 0 | 1 | 0 | 1 | 0 | 0 | 0 | 0 | 1 | 0 |
| 720 | TPFFP4410O | 87.5 | 108.0 | 0 | 3 | 2.0 | 2.0 | 2.0 | 3.0 | 3.0 | ... | 0 | 1 | 0 | 1 | 0 | 0 | 0 | 0 | 1 | 0 |
| 759 | TPFFP4410O | 82.5 | 131.0 | 4 | 1 | 2.0 | 2.0 | 0.0 | 0.0 | 1.0 | ... | 0 | 0 | 1 | 0 | 0 | 0 | 0 | 0 | 1 | 0 |
| 779 | TPFFP4410O | 57.5 | 145.0 | 0 | 0 | 0.0 | 0.0 | 0.0 | 0.0 | 2.0 | ... | 0 | 1 | 1 | 0 | 0 | 0 | 0 | 0 | 1 | 1 |
| 898 | TPFFP4410O | 67.5 | 162.0 | 1 | 0 | 0.0 | 0.0 | 1.0 | 2.0 | 3.0 | ... | 0 | 0 | 1 | 0 | 0 | 0 | 0 | 0 | 1 | 1 |
5 rows × 101 columns
Misclassifications#
If a patient is misclassified by the hospital model for the hospital that they attended, this suggests there is a patient in the data set used to train the model that is similar yet was treated differently
Find misclassified patients in test cohort#
forest, threshold, _, _ = hospital2model[hospital]
y_test = test_patients_df['S2Thrombolysis'].values
X_test = test_patients_df.drop(['StrokeTeam', 'S2Thrombolysis'], axis=1).values

y_prob = forest.predict_proba(X_test)[:,1]
y_pred = np.array([1 if p >= threshold else 0 for p in y_prob])
misclassified = np.where(y_pred!=y_test)[0]
misclassified
array([ 8, 16, 17, 20, 21, 22, 33, 39])
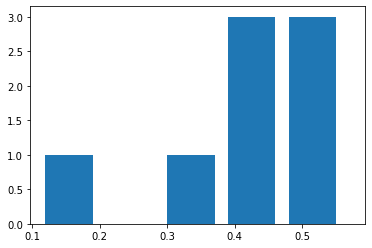
Posterior probability distribution#
probs = y_prob[misclassified]

plt.hist(probs, 5, width=0.07)

plt.show()
Similarity Metric#
When a decision tree is fit to the training data, each internal node in the tree will be split into two further nodes based on the feature that maximises the information gain (or minimises the entropy). Once a split results in two nodes that are pure (only containing samples from a single class) no further information gain is possible: the two nodes are leaves, representing the ends of two paths through the tree. As each patient can take only one path through the decision tree, and all patients start in the same node (the root node), we can use these paths to find the similarity between any pair of patients:
\(S(i,j) = \frac{P(i,j)}{\sqrt{P(i)P(j)}}\).
Here, \(S(i,j)\) represents the similarity between patient \(i\) and patient \(j\) as a function of each patient’s path, \(P\), through the decision tree, where \(P(i)\) correspond to the path length of patient \(i\), \(P(j)\) the path length of \(j\) and \(P(i,j)\) the length of the shared path of \(i\) and \(j\).
Path length is measured using the information gain (change in entropy) at each split. Consider patient \(z\), who takes a path through the decision tree which is comprised of a set of \(N\) nodes, each passed sequentially and with index \(n \in [1,N]\), where \(n=1\) represents the root node and \(n=N\) the leaf node. If each node with index \(n\) has \(X_n\) patients passing through it, the length of the path of patient \(z\), \(P(z)\), is given by:
\(P(z)= \sum_{n=1}^{N-1} X_{n+1} (H_n - H_{n+1} \frac{X_{n+1}}{X_n})\),
where \(H_n\) is the entropy at node \(n\) and the information gain at each split has been weighted by \(X_{n+1}\), the total number of patients that move from node \(n\) to node \(n+1\).
From the second equation it is clear that if patients \(i\) and \(j\) take exactly the same path through the decision tree their path lengths are equal: \(P(i) = P(j) = P(i,j)\). Substituting this into the first equation it is clear that if two patients take identical paths the similarity between them is one. Conversely, if patients \(i\) and \(j\) diverge at the root node (\(n=1\)), their shared path contains only this node: \(P(i,j) = 0\) and hence the similarity between them is equal to zero.
As a random forest is composed of many decision trees, for each pair of patients we take the distance between them as the average over all trees in the forest. Using this measure of similarity, for each patient in each hospital we found the most similar patients that are treated differently.
Functions#
Node weights#
def find_information_gain(X_train, y_train, estimator):

    """
    Function to find the information gain for each branch in a tree

    Input

    X_train: (numpy array) features used to train the DecisionTree classifier
    y_train: (numpy array) target used to train the DecisionTree classifier
    estimator: (sklearn model) trained DecisionTree classifier

    Output

    info_gain: (numpy array) information gain associated with move to child
                             node (node i) from parent node.
    """


    # claculate the entropy of each node

    y_true = np.where(y_train==1)
    y_false = np.where(y_train==0)

    X_true = X_train[y_true]
    X_false = X_train[y_false]

    node_indicator_false = estimator.decision_path(X_false).toarray()
    node_indicator_true = estimator.decision_path(X_true).toarray()

    total_passing_true = node_indicator_true.sum(axis=0)
    total_passing_false = node_indicator_false.sum(axis=0)

    n_nodes = len(total_passing_true)

    entropies = np.zeros(n_nodes)

    left_child = estimator.tree_.children_left
    right_child = estimator.tree_.children_right

    for i in range(n_nodes):

        true = total_passing_true[i]
        false = total_passing_false[i]

        if true==0 and false==0:

            print('Node Not Passed')

            continue

        if true==0 or false==0:

            entropies[i] = 0

        else:

            entropies[i] = -(true/(true+false)) * np.log2(true/(true+false)) \
                            - (false/(true+false))*np.log2(false/(true+false))


    # use the entropy to calculate the information gain for each node

    info_gain = np.zeros(n_nodes)


    total_passing = estimator.decision_path(X_train).toarray().sum(axis=0)

    for i in range(1,n_nodes):


        loc_left = np.where(left_child==i)[0]
        loc_right = np.where(right_child==i)[0]

        if len(loc_left==1):

            parent = loc_left[0]


        elif len(loc_right==1):

            parent = loc_right[0]

        else:

            raise Exception("Cant find parent")


        info_gain[i] = entropies[parent] - \
                        total_passing[i]*entropies[i]/total_passing[parent]


    return info_gain
def find_node_weight(X_train, y_train, estimator):

    """
    Function to find the weight of a node. Weight is defined as the product
    of the number of data points passing the node (flow) and the information
    gain at the node.

    Input

    X_train: (numpy array) features used to train the DecisionTree classifier
    y_train: (numpy array) target used to train the DecisionTree classifier
    estimator: (sklearn model) trained DecisionTree classifier

    Output

    weight: (numpy array) weight (flows * info_gain) of each node

    """

    node_indicator = estimator.decision_path(X_train).toarray()

    flows = node_indicator.sum(axis=0)

    info_gain = find_information_gain(X_train, y_train, estimator)

    if len(flows) != len(info_gain):

        raise Exception("Length mismatch")

    return flows*info_gain
def find_forest_weight(X_train, y_train, forest):

    trees = forest.estimators_

    results = []

    for i,estimator in enumerate(trees):

        weight = find_node_weight(X_train, y_train, estimator)

        results.append(weight)

    return np.array(results)
Caclulate Similarity#
def find_similar_patients_tree(patient, test_set, estimator, weights):

    """
    Function to calculate the similarity between a single patient and all other
    patients in a data set using a single DecisionTree classifier

    Input

    patient:    index of comparison patient in test_set
    test_set:   sub-set of n data points unseen by estimator. Must include
                patient
    estimator:  trained sklearn DecisionTreeClassifier
    weights:    array of length n-nodes.

    Output

    similarity: (n-dim array) index of patients and similarity

    """

    similarity = np.zeros(test_set.shape[0])

    paths = estimator.decision_path(test_set)

    patient_nodes = paths.toarray()[patient]

    for n in range(test_set.shape[0]):

        sample_ids = [patient, n]

        patient_paths = paths.toarray()[sample_ids]

        common_nodes = (patient_paths.sum(axis=0) ==
                    len(sample_ids))

        common_node_weights = weights[common_nodes]

        path_length = sum(common_node_weights)

        p0_path_length = sum(patient_paths[0]*weights)
        p1_path_length = sum(patient_paths[1]*weights)

        similar = path_length / np.sqrt(p0_path_length*p1_path_length)

        similarity[n] = similar

    return similarity
def find_similar_patients(patient, test_set, forest, weights):

    """
    Function to calculate the similarity between a single patient and all other
    patients in a data set using a RandomForest classifier

    Input

    patient:    index of comparison patient in test_set
    test_set:   sub-set of n data points unseen by estimator. Must include
                patient
    forest:     trained sklearn RandomForestClassifier
    weights:    array of length n-nodes.

    Output

    results: (n-dim array) similarity between patient and test_set for each tree
                           in the RandomForest classifier
    """

    trees = forest.estimators_

    results = np.zeros((len(trees), test_set.shape[0]))

    for i,estimator in enumerate(trees):

        similarity = find_similar_patients_tree(patient, test_set, estimator, weights[i])

        results[i] = similarity

    return results
Example hospital#
forest, threshold, train_patients, train_outcomes = hospital2model[hospital]
weights = find_forest_weight(train_patients, train_outcomes, forest)
weights.shape
(100,)
Pairwise similarity#
test_patients = test_patients_df.drop(['StrokeTeam', 'S2Thrombolysis'], axis=1).values
test_outcomes = test_patients_df['S2Thrombolysis'].values
similarity = find_similar_patients(0, test_patients, forest, weights)
similarity.shape
(100, 42)
similarity contains one row for each decision tree in the random forest classifier. Each row contains the pairwise similarity between patient and all other patients.
Note that the similarity between patient and itself (in this case, element 0 of each row) is always equal to 1.
# average similarity across all trees
results = similarity.sum(axis=0)/100
results
array([1.        , 0.41878349, 0.41385524, 0.30315102, 0.28188906,
       0.31645625, 0.44306756, 0.17333223, 0.35602158, 0.46386653,
       0.2490115 , 0.33010815, 0.50437351, 0.12329451, 0.17538473,
       0.19784455, 0.35274581, 0.29956862, 0.29864365, 0.2882998 ,
       0.18215119, 0.39094488, 0.35923549, 0.39327842, 0.41762123,
       0.48577199, 0.11948557, 0.21997094, 0.40880923, 0.50791922,
       0.38785235, 0.30787927, 0.53550742, 0.42006776, 0.23841425,
       0.3628097 , 0.20345056, 0.33015945, 0.16756539, 0.24487966,
       0.16356513, 0.29071159])
Most similar patients with a different outcome#
Identify patients with a predicted outcome different to their true outcome#
predicted_outcome = forest.predict(test_patients)

patient_index = np.where(predicted_outcome!=test_outcomes)[0]
patient_index
array([ 8, 17, 20, 29, 39])
Show actual outcomes for patients:
actual = [test_outcomes[i] for i in patient_index]

print ('Actual:', actual)
Actual: [0, 1, 1, 1, 1]
For each patient, find 5 most similar patients with a different outcome in training set#
%%time

most_similar = []

for i in patient_index:

    patient = test_patients[i]

    outcome = test_outcomes[i]

    opposite = np.where(train_outcomes != outcome)[0]


    X = np.vstack((patient, train_patients[opposite]))
    y = np.concatenate(([outcome], train_outcomes[opposite]))

    results = find_similar_patients(0, X, forest, weights)

    summed_results = results.sum(axis=0)[1:] #remove similarity between patient and itself

    five_indices = np.argpartition(summed_results, -5)[-5:]

    similar_patients = train_patients[opposite][five_indices]

    S = summed_results[five_indices]

    most_similar.append([S, summed_results, outcome, i, patient, similar_patients])
CPU times: user 7.32 s, sys: 0 ns, total: 7.32 s
Wall time: 7.32 s
Get feature importances for hospital#
features = cohort.drop(['StrokeTeam', 'S2Thrombolysis'], axis=1).columns.values
importances = forest.feature_importances_
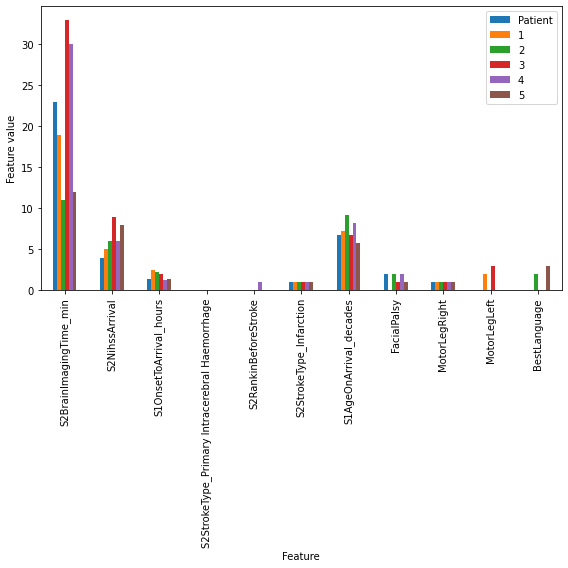
Example where thrombolysis was not given when expected#
patient_of_interest = 0
Create dataframe for patient#
S, _, _, _, patient, similar_patients = most_similar[patient_of_interest]
S_index = np.argsort(S)
S_index
array([0, 1, 3, 4, 2])
patient_df = pd.DataFrame(index = features)
patient_df['Importance'] = importances
patient_df['Patient'] = patient

for i,s in enumerate(S_index):

    patient_df[str(i+1)] = similar_patients[s]
Sort dataframe according to feature importance#
patient_df = patient_df.sort_values(by='Importance', ascending=False)
patient_df.drop(['Importance'], axis=1, inplace=True)
patient_df.to_csv('./output/similar_patients_treated_differently_1.csv')

patient_df
| Patient | 1 | 2 | 3 | 4 | 5 | |
|---|---|---|---|---|---|---|
| S2BrainImagingTime_min | 23.0 | 19.0 | 11.0 | 33.0 | 30.0 | 12.0 |
| S2NihssArrival | 4.0 | 5.0 | 6.0 | 9.0 | 6.0 | 8.0 |
| S1OnsetToArrival_min | 83.0 | 149.0 | 134.0 | 121.0 | 79.0 | 82.0 |
| S2StrokeType_Primary Intracerebral Haemorrhage | 0.0 | 0.0 | 0.0 | 0.0 | 0.0 | 0.0 |
| S2RankinBeforeStroke | 0.0 | 0.0 | 0.0 | 0.0 | 1.0 | 0.0 |
| ... | ... | ... | ... | ... | ... | ... |
| AFAnticoagulentHeparin_Yes | 0.0 | 0.0 | 0.0 | 0.0 | 0.0 | 0.0 |
| S1OnsetInHospital_Yes | 0.0 | 0.0 | 0.0 | 0.0 | 0.0 | 0.0 |
| S1OnsetInHospital_No | 1.0 | 1.0 | 1.0 | 1.0 | 1.0 | 1.0 |
| S1Ethnicity_Mixed | 0.0 | 0.0 | 0.0 | 0.0 | 0.0 | 0.0 |
| S1OnsetTimeType_Not known | 0.0 | 0.0 | 0.0 | 0.0 | 0.0 | 0.0 |
99 rows × 6 columns
Rescale#
As some features, such as stroke to arrival time and age, have a much larger range than other features, we rescale them so that all features can be visualised on one axis
def rescale(row, df, time=False, age=False):

    vals = df.iloc[row].values

    if len(set(vals))==1:

        rescaled=vals

    if time==True:

        rescaled=vals/60

    elif age==True:

        rescaled=vals/10

    else:
        #rescaled = [(v - vals[0]) for v in vals]
        rescaled = vals

    return rescaled
rescaled_results = patient_df.copy()

indx_list = rescaled_results.index.tolist()

for i in range(len(rescaled_results)):

    indx = rescaled_results.index[i]

    if indx in ['S1OnsetToArrival_min']:#, 'S2BrainImagingTime_min']:

        rescaled = rescale(i,rescaled_results, time=True)
        indx_list[i] = indx.split('_')[0] + '_hours'

    elif indx in ['S1AgeOnArrival']:

        rescaled = rescale(i,rescaled_results, age=True)
        indx_list[i] = indx + '_decades'

    else:
        rescaled = rescale(i,rescaled_results)

    rescaled_results.loc[indx]=rescaled

rescaled_results.index = indx_list
Plot#
rescaled_results.plot(kind='bar',  stacked=False, alpha=1, figsize=(8,8),
                     xlabel='Feature', ylabel='Feature value')

plt.xlim(None,10.5)

plt.tight_layout()

plt.savefig('./figures/within_hospital_variability/5_similar_bar_patient_not_treated.jpg', dpi=300)
plt.show()
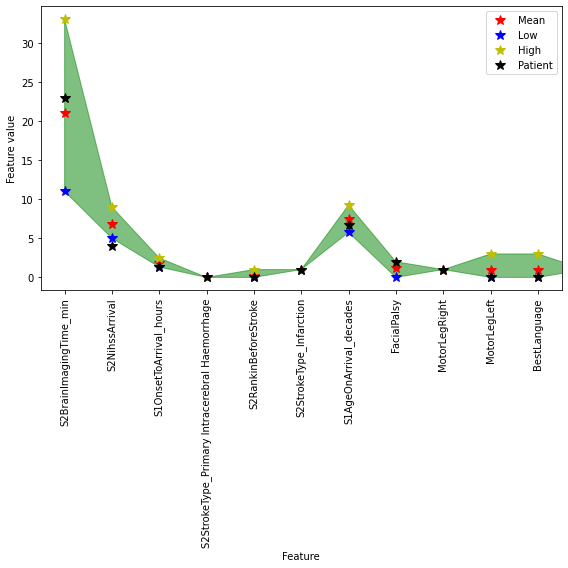
fig,ax = plt.subplots(figsize=(8,8))

xvals = rescaled_results.index.values
pvals = rescaled_results['Patient']
mvals = [np.mean(rescaled_results.loc[feature].values[1:]) for feature in rescaled_results.index]
lvals = [min(rescaled_results.loc[feature].values[1:]) for feature in rescaled_results.index]
hvals = [max(rescaled_results.loc[feature].values[1:]) for feature in rescaled_results.index]

plt.plot(xvals, mvals, 'r*', ms=10, label='Mean')
plt.plot(xvals, lvals, 'b*', ms=10, label='Low')
plt.plot(xvals, hvals, 'y*', ms=10, label='High')
plt.plot(xvals, pvals, 'k*', ms=10, label='Patient')
plt.fill_between(xvals, lvals, hvals, color='g', alpha=0.5)
plt.xlim(-0.5,10.5)
plt.xticks(rotation=90)
plt.legend(loc='best')
ax.set_xlabel('Feature')
ax.set_ylabel('Feature value')
plt.tight_layout()

plt.savefig('./figures/within_hospital_variability/5_similar_range_patient_not_treated.jpg', dpi=300)

plt.show()
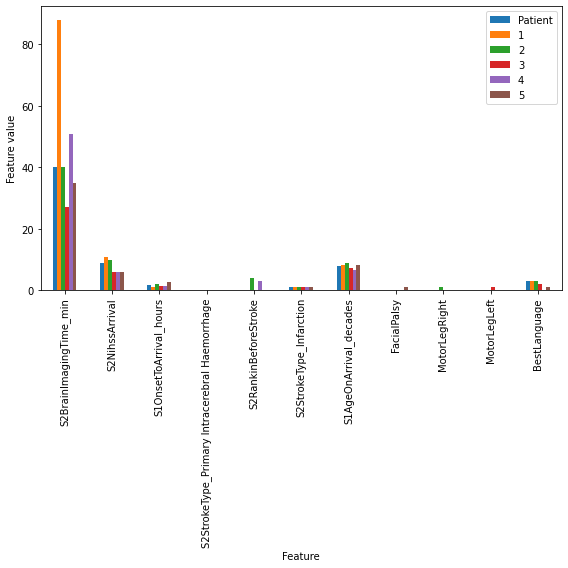
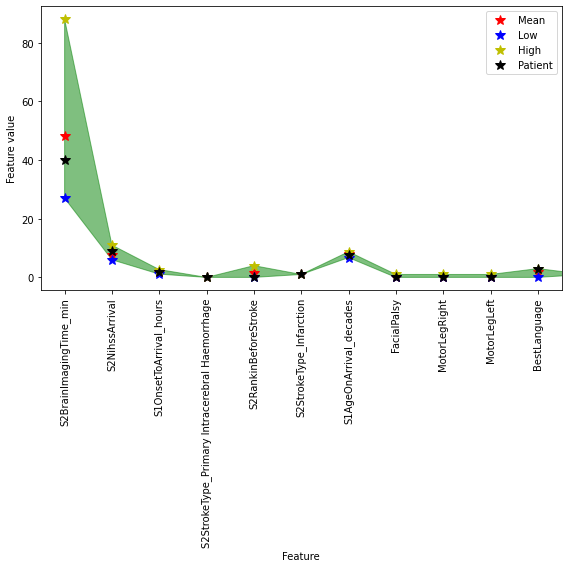
Example where thrombolysis was given when not expected#
patient_of_interest = 1

S, _, _, _, patient, similar_patients = most_similar[patient_of_interest]
S_index = np.argsort(S)
S_index
array([0, 1, 2, 3, 4])
patient_df = pd.DataFrame(index = features)
patient_df['Importance'] = importances
patient_df['Patient'] = patient

for i,s in enumerate(S_index):
    patient_df[str(i+1)] = similar_patients[s]

patient_df = patient_df.sort_values(by='Importance', ascending=False)
patient_df.drop(['Importance'], axis=1, inplace=True)
patient_df.to_csv('./output/similar_patients_treated_differently_2.csv')

patient_df
| Patient | 1 | 2 | 3 | 4 | 5 | |
|---|---|---|---|---|---|---|
| S2BrainImagingTime_min | 40.0 | 88.0 | 40.0 | 27.0 | 51.0 | 35.0 |
| S2NihssArrival | 9.0 | 11.0 | 10.0 | 6.0 | 6.0 | 6.0 |
| S1OnsetToArrival_min | 105.0 | 67.0 | 122.0 | 83.0 | 75.0 | 160.0 |
| S2StrokeType_Primary Intracerebral Haemorrhage | 0.0 | 0.0 | 0.0 | 0.0 | 0.0 | 0.0 |
| S2RankinBeforeStroke | 0.0 | 0.0 | 4.0 | 0.0 | 3.0 | 0.0 |
| ... | ... | ... | ... | ... | ... | ... |
| AFAnticoagulentHeparin_Yes | 0.0 | 0.0 | 0.0 | 0.0 | 0.0 | 0.0 |
| S1OnsetInHospital_Yes | 0.0 | 0.0 | 0.0 | 0.0 | 0.0 | 0.0 |
| S1OnsetInHospital_No | 1.0 | 1.0 | 1.0 | 1.0 | 1.0 | 1.0 |
| S1Ethnicity_Mixed | 0.0 | 0.0 | 0.0 | 0.0 | 0.0 | 0.0 |
| S1OnsetTimeType_Not known | 0.0 | 0.0 | 0.0 | 0.0 | 0.0 | 0.0 |
99 rows × 6 columns
Rescale:
rescaled_results = patient_df.copy()

indx_list = rescaled_results.index.tolist()

for i in range(len(rescaled_results)):

    indx = rescaled_results.index[i]

    if indx in ['S1OnsetToArrival_min']:#, 'S2BrainImagingTime_min']:

        rescaled = rescale(i,rescaled_results, time=True)
        indx_list[i] = indx.split('_')[0] + '_hours'

    elif indx in ['S1AgeOnArrival']:

        rescaled = rescale(i,rescaled_results, age=True)
        indx_list[i] = indx + '_decades'

    else:
        rescaled = rescale(i,rescaled_results)

    rescaled_results.loc[indx]=rescaled

rescaled_results.index = indx_list
Plot
rescaled_results.plot(kind='bar',  stacked=False, alpha=1, figsize=(8,8),
                      xlabel='Feature', ylabel='Feature value')

plt.xlim(None,10.5)

plt.tight_layout()

plt.savefig('./figures/within_hospital_variability/5_similar_bar_patient_treated.jpg', dpi=300)
plt.show()
fig,ax = plt.subplots(figsize=(8,8))

xvals = rescaled_results.index.values
pvals = rescaled_results['Patient']
mvals = [np.mean(rescaled_results.loc[feature].values[1:]) for feature in rescaled_results.index]
lvals = [min(rescaled_results.loc[feature].values[1:]) for feature in rescaled_results.index]
hvals = [max(rescaled_results.loc[feature].values[1:]) for feature in rescaled_results.index]

plt.plot(xvals, mvals, 'r*', ms=10, label='Mean')
plt.plot(xvals, lvals, 'b*', ms=10, label='Low')
plt.plot(xvals, hvals, 'y*', ms=10, label='High')
plt.plot(xvals, pvals, 'k*', ms=10, label='Patient')
plt.fill_between(xvals, lvals, hvals, color='g', alpha=0.5)
plt.xlim(-0.5,10.5)
plt.xticks(rotation=90)
plt.legend(loc='best')
ax.set_xlabel('Feature')
ax.set_ylabel('Feature value')

plt.tight_layout()

plt.savefig('./figures/within_hospital_variability/5_similar_range_patient_treated.jpg', dpi=300)

plt.show()
Observations#
Misclassifications indicate that there is variability in clinical decision making within a hospital
We can use the structure of the Random Forest classifier to define a similarity metric
For patients that are incorrectly classified, we can find similar patients that were treated differently, further demonstrating variation in decision making within a hospital