Analysis of pre-stroke modified Rankin Scale
Contents
Analysis of pre-stroke modified Rankin Scale#
Distributions of mRS (modified Rankin Scale) are shown for:
All patients
Ischaemic and haemorrhagic stroke
Ischaemic patients with NIHSS of 0-10 (surrogate for non large vessel occlusions)
Ischaemic patients with NIHSS of 11+ (surrogate for large vessel occlusions)
# import libraries
import matplotlib.pyplot as plt
import numpy as np
import pandas as pd

# Change default colour scheme:
plt.style.use('seaborn-colorblind')

# import data
data = pd.read_csv(
    './../data/2019-11-04-HQIP303-Exeter_MA.csv', low_memory=False)
Get distribution of mRS before stroke for all patients#
count, division = np.histogram(data['S2RankinBeforeStroke'], bins=range(0,7))

results = pd.DataFrame()
results.index.name='mRS'
results['all'] = count / count.sum()
results
| all | |
|---|---|
| mRS | |
| 0 | 0.533043 |
| 1 | 0.156302 |
| 2 | 0.107781 |
| 3 | 0.121422 |
| 4 | 0.063581 |
| 5 | 0.017870 |
Get distribution of mRS before stroke by stroke type#
# Infarction
mask = data['S2StrokeType'] == 'Infarction'
count, division = np.histogram(
    data[mask]['S2RankinBeforeStroke'], bins=range(0,7))
results['infarction'] = count / count.sum()

# Haemorrhage
mask = data['S2StrokeType'] == 'Primary Intracerebral Haemorrhage'
count, division = np.histogram(
    data[mask]['S2RankinBeforeStroke'], bins=range(0,7))
results['haemorrhage'] = count / count.sum()

# Show results
results
| all | infarction | haemorrhage | |
|---|---|---|---|
| mRS | |||
| 0 | 0.533043 | 0.534923 | 0.521374 |
| 1 | 0.156302 | 0.157958 | 0.144905 |
| 2 | 0.107781 | 0.108075 | 0.106007 |
| 3 | 0.121422 | 0.119199 | 0.137272 |
| 4 | 0.063581 | 0.062649 | 0.068735 |
| 5 | 0.017870 | 0.017196 | 0.021706 |
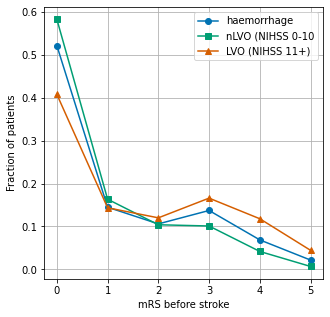
mRS for ischaemic stroke, by stroke severity#
# Filter data
mask = data['S2StrokeType'] == 'Infarction'
data = data[mask]

# NIHSS 0-10 is a surrogate for non large vessel occlusions
mask = data['S2NihssArrival'] < 11
count, division = np.histogram(
    data[mask]['S2RankinBeforeStroke'], bins=range(0,7))
results['nlvo'] = count / count.sum()

# NIHSS 11+ is a surrogate for non large vessel occlusions
mask = data['S2NihssArrival'] > 10
count, division = np.histogram(
    data[mask]['S2RankinBeforeStroke'], bins=range(0,7))
results['lvo'] = count / count.sum()

# Show results
results
| all | infarction | haemorrhage | nlvo | lvo | |
|---|---|---|---|---|---|
| mRS | |||||
| 0 | 0.533043 | 0.534923 | 0.521374 | 0.582771 | 0.407796 |
| 1 | 0.156302 | 0.157958 | 0.144905 | 0.163513 | 0.143538 |
| 2 | 0.107781 | 0.108075 | 0.106007 | 0.103988 | 0.120133 |
| 3 | 0.121422 | 0.119199 | 0.137272 | 0.101109 | 0.166050 |
| 4 | 0.063581 | 0.062649 | 0.068735 | 0.041796 | 0.118023 |
| 5 | 0.017870 | 0.017196 | 0.021706 | 0.006822 | 0.044460 |
fig = plt.figure(figsize=(5,5))
ax = fig.add_subplot()
width = 0.17
x = results.index
ax.bar(x - width * 2, results['all'], width, label='all')
ax.bar(x, results['haemorrhage'], width, label='haemorrhage')
ax.bar(x + width, results['nlvo'], width, label='nLVO (NIHSS 0-10')
ax.bar(x + width * 2, results['lvo'], width, label='LVO (NIHSS 11+)')
ax.set_ylabel('Fraction of patients')
ax.set_xlabel('mRS before stroke')
ax.legend()
plt.savefig('./output/mrs_before_by_stroke_type.jpg', dpi=300)
plt.show()
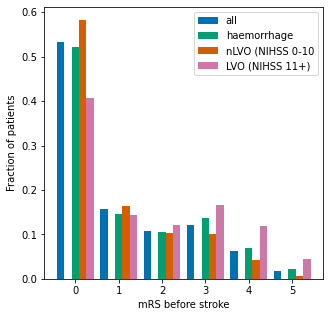
fig = plt.figure(figsize=(5,5))
ax = fig.add_subplot()
width = 0.17
x = results.index
#ax.plot(results['all'], label='all')
ax.plot(results['haemorrhage'], marker='o', label='haemorrhage')
ax.plot(results['nlvo'], marker = 's', label='nLVO (NIHSS 0-10')
ax.plot(results['lvo'], marker = '^', label='LVO (NIHSS 11+)')
ax.grid()
ax.set_ylabel('Fraction of patients')
ax.set_xlabel('mRS before stroke')
ax.legend()
plt.savefig('./output/mrs_before_by_stroke_type.jpg', dpi=300)
plt.show()