Benchmark hospitals
Contents
Benchmark hospitals#
Aims#
Predict thrombolysis decisions for a 10k cohort of patients at all hospitals
Select top 30 hospitals (highest predicted thrombolysis use in 10k cohort). This is the ‘benchmark’ set of hospitals.
Predict decision of those benchmark set of hospitals for all patients at each hospital. Use a majority vote to classify as whether the patient would receive thrombolysis or not.
Compare actual thrombolysis use with thrombolysis use if decisions made by majority vote of benchmark hospitals.
Import libraries#
# Turn warnings off to keep notebook tidy
import warnings
warnings.filterwarnings("ignore")

import os
import matplotlib.pyplot as plt
import numpy as np
import pandas as pd
import pickle as pkl

import matplotlib.cm as cm
import matplotlib.colors as colors
from matplotlib.lines import Line2D

from sklearn.ensemble import RandomForestClassifier
Load pre-trained hospital models into dictionary hospital2model#
keys = hospitals
values = trained_classifier, threshold, patients, outcomes
with open ('./models/trained_hospital_models.pkl', 'rb') as f:

    hospital2model = pkl.load(f)
Import 10k cohort#
10k cohort all arrive at hospital within 4 hours of known stroke onset
cohort = pd.read_csv('../data/10k_training_test/cohort_10000_test.csv')
Pass cohort through all hospital models#
Allow for new analysis or used loaded resulkts from previous analysis.
hospitals = list(set(cohort['StrokeTeam'].values))

# Set re_analyse to run analysis again, else loads saved data
re_analyse = False

if re_analyse:

    # Get decisions for 10k patients at each hospital

    y_test = cohort['S2Thrombolysis']
    X_test =  cohort.drop(['StrokeTeam', 'S2Thrombolysis'], axis=1)

    results = pd.DataFrame()

    for hospital_train in hospitals:

        model, threshold, _, _ = hospital2model[hospital_train]

        y_prob = model.predict_proba(X_test)[:,1]

        y_pred = [1 if p >= threshold else 0 for p in y_prob]

        results[hospital_train] = y_pred

    results.to_csv('./predictions/10k_decisions.csv', index=False)

else:
    results = pd.read_csv('./predictions/10k_decisions.csv')
results
| TQQYU0036V | JHDQL1362V | JXJYG0100P | LFPMM4706C | JADBS8258F | MHMYL4920B | NZECY6641V | VZOCK3505U | NTPQZ0829K | JRXDG8181O | ... | QOAPO4699N | SBRDX1922J | CYVHC2532V | AGNOF1041H | AOBTM3098N | ISXKM9668U | SBYTE4026H | LGNPK4211W | UALFR2142B | RDVPJ0375X | |
|---|---|---|---|---|---|---|---|---|---|---|---|---|---|---|---|---|---|---|---|---|---|
| 0 | 0 | 0 | 0 | 0 | 0 | 0 | 0 | 0 | 0 | 0 | ... | 0 | 0 | 0 | 0 | 0 | 0 | 0 | 0 | 0 | 0 |
| 1 | 1 | 1 | 0 | 0 | 1 | 1 | 1 | 1 | 1 | 1 | ... | 1 | 1 | 1 | 0 | 1 | 0 | 0 | 0 | 1 | 0 |
| 2 | 0 | 0 | 0 | 0 | 0 | 0 | 0 | 0 | 0 | 0 | ... | 0 | 0 | 0 | 0 | 0 | 0 | 0 | 0 | 0 | 0 |
| 3 | 1 | 1 | 0 | 0 | 1 | 1 | 1 | 1 | 1 | 1 | ... | 1 | 1 | 1 | 1 | 0 | 0 | 1 | 0 | 1 | 0 |
| 4 | 0 | 0 | 0 | 0 | 0 | 0 | 0 | 0 | 0 | 0 | ... | 0 | 0 | 0 | 0 | 0 | 0 | 0 | 0 | 0 | 0 |
| ... | ... | ... | ... | ... | ... | ... | ... | ... | ... | ... | ... | ... | ... | ... | ... | ... | ... | ... | ... | ... | ... |
| 9995 | 0 | 0 | 0 | 0 | 0 | 0 | 0 | 0 | 0 | 0 | ... | 0 | 0 | 0 | 0 | 0 | 0 | 0 | 0 | 0 | 0 |
| 9996 | 0 | 0 | 0 | 0 | 0 | 1 | 0 | 1 | 1 | 0 | ... | 0 | 0 | 0 | 0 | 0 | 0 | 1 | 0 | 0 | 0 |
| 9997 | 0 | 1 | 0 | 0 | 1 | 1 | 1 | 1 | 1 | 1 | ... | 1 | 0 | 0 | 1 | 0 | 0 | 0 | 0 | 1 | 0 |
| 9998 | 0 | 0 | 0 | 0 | 0 | 0 | 0 | 0 | 0 | 0 | ... | 0 | 0 | 0 | 0 | 0 | 0 | 0 | 0 | 0 | 0 |
| 9999 | 0 | 0 | 0 | 0 | 0 | 0 | 0 | 0 | 0 | 0 | ... | 0 | 0 | 0 | 0 | 0 | 0 | 0 | 0 | 0 | 0 |
10000 rows × 132 columns
Summarise results#
hospital_compare = pd.DataFrame()

hospital_compare['hospital'] = hospitals

hospital_compare['true_rate'] = [
    sum(hospital2model[h][-1])*100/len(hospital2model[h][-1]) for h in hospitals]

hospital_compare['cohort_rate'] = [
    sum(results[h].values)*100/10000 for h in hospitals]

hospital_compare['ratio'] = \
    hospital_compare['cohort_rate'] / hospital_compare['true_rate']

# Label top 30 corhort thrombolysis as benchmark
hospital_compare.sort_values('cohort_rate', inplace=True, ascending=False)
top_30 = [True for x in range(30)]
top_30.extend([False for x in range(len(hospitals)-30)])
hospital_compare['benchmark'] = top_30
hospital_compare
| hospital | true_rate | cohort_rate | ratio | benchmark | |
|---|---|---|---|---|---|
| 118 | VKKDD9172T | 28.305235 | 50.70 | 1.791188 | True |
| 17 | TPXYE0168D | 31.578947 | 48.04 | 1.521267 | True |
| 5 | CNBGF2713O | 48.148148 | 43.30 | 0.899308 | True |
| 19 | NTPQZ0829K | 34.910486 | 42.82 | 1.226566 | True |
| 1 | GKONI0110I | 38.906752 | 42.53 | 1.093126 | True |
| ... | ... | ... | ... | ... | ... |
| 44 | ISXKM9668U | 9.569378 | 12.76 | 1.333420 | False |
| 69 | LGNPK4211W | 22.654462 | 12.76 | 0.563244 | False |
| 71 | XPABC1435F | 21.768707 | 12.10 | 0.555844 | False |
| 114 | VVDIY0129H | 19.130435 | 10.41 | 0.544159 | False |
| 35 | LFPMM4706C | 6.333333 | 9.96 | 1.572632 | False |
132 rows × 5 columns
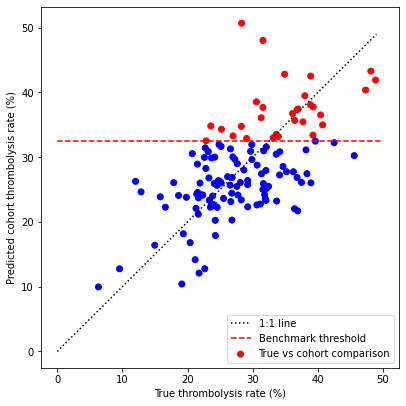
fig = plt.figure(figsize=(6,6))

# Plot copmparison of True rate vs. Corhort rate
ax1 = fig.add_subplot()


colour = ['r'] * 30
colour.extend(['b'] * (len(hospitals) -30 ))


ax1.scatter(hospital_compare['true_rate'],
            hospital_compare['cohort_rate'],
            color=colour,
            label='True vs cohort comparison')

# Add 1:1 line
xx = np.arange(0,50)
ax1.plot(xx,xx, 'k:', label = '1:1 line')

# Add benchmark threshold
mask = hospital_compare['benchmark']
threshold = hospital_compare[mask]['cohort_rate'].min()

ax1.plot([0, 50], [threshold, threshold], 'r--', label='Benchmark threshold')

ax1.set_xlabel('True thrombolysis rate (%)')
ax1.set_ylabel('Predicted cohort thrombolysis rate (%)')
ax1.set_title('')

ax1.legend(loc='lower right')

plt.tight_layout(pad=2)
plt.savefig('./output/benchmark_cohort_with_threshold.jpg', dpi=300)
plt.show()
Take majority decision of benchmark hospitals#
benchmark_hospitals = hospital_compare['hospital'][0:30]
np.save('./models/benchmark_hospitals.npy', benchmark_hospitals)
# Set re_analyse to run analysis again, else loads saved data
re_analyse = False

if re_analyse:

    columns = \
        np.concatenate((['Hospital','True', 'Majority'], benchmark_hospitals))

    results_30 = pd.DataFrame(columns = columns)


    for i, hospital in enumerate(hospitals):

        # Show progress
        print(f'Hospital {i+1} of {len(hospitals)}', end='\r')

        # Get hospital model
        _, _, X, y = hospital2model[hospital]

        # Get hospital level results
        hospital_results = pd.DataFrame(columns = columns)

        # Loop through benchmark hospitals
        for j, top_hospital in enumerate(benchmark_hospitals):
            model, threshold, _, _ = hospital2model[top_hospital]
            y_prob = model.predict_proba(X)[:,1]
            y_pred = [1 if p >= threshold else 0 for p in y_prob]
            hospital_results[top_hospital] = y_pred

        # Add to results
        hospital_results['Hospital'] = [hospital for person in y]
        hospital_results['True'] = y
        results_30 = results_30.append(hospital_results, ignore_index=True)

    # Add majority decsion
    majority_threshold = 15/30
    for index,row in results_30.iterrows():
        no = sum([1 for val in row[3:].values if val ==0])
        yes = sum(row[3:].values)
        if yes/(no+yes)>=majority_threshold:
            results_30.loc[index, 'Majority'] = 1
        else:
            results_30.loc[index, 'Majority'] = 0

    results_30.to_csv('./predictions/benchmark_decisions.csv', index=False)

else:
    # Load previous results
    results_30 = pd.read_csv('./predictions/benchmark_decisions.csv')
Repeat analysis just for patients scanned within 4 hours of onset#
This value is used in the pathway simulation model.
# Set re_analyse to run analysis again, else loads saved data
re_analyse = False

if re_analyse:

    columns = \
        np.concatenate((['Hospital','True', 'Majority'], benchmark_hospitals))

    results_30_4_hr_scan = pd.DataFrame(columns = columns)


    for i, hospital in enumerate(hospitals):

        # Show progress
        print(f'Hospital {i+1} of {len(hospitals)}', end='\r')

        # Get hospital model
        _, _, X, y = hospital2model[hospital]

        # Limit to those scanned in 4 hours from onset
        onset_scan = X[:, 1] + X[:, 19]
        mask = onset_scan <= 240
        X = X[mask]
        y = y[mask]

        # Get hospital level results
        hospital_results = pd.DataFrame(columns = columns)

        # Loop through benchmark hospitals
        for j, top_hospital in enumerate(benchmark_hospitals):
            model, threshold, _, _ = hospital2model[top_hospital]
            y_prob = model.predict_proba(X)[:,1]
            y_pred = [1 if p >= threshold else 0 for p in y_prob]
            hospital_results[top_hospital] = y_pred

        # Add to results
        hospital_results['Hospital'] = [hospital for person in y]
        hospital_results['True'] = y
        results_30_4_hr_scan = \
            results_30_4_hr_scan.append(hospital_results, ignore_index=True)

    # Add majority decsion
    majority_threshold = 15/30
    for index,row in results_30_4_hr_scan.iterrows():
        no = sum([1 for val in row[3:].values if val ==0])
        yes = sum(row[3:].values)
        if yes/(no+yes)>=majority_threshold:
            results_30_4_hr_scan.loc[index, 'Majority'] = 1
        else:
            results_30_4_hr_scan.loc[index, 'Majority'] = 0

    results_30_4_hr_scan.to_csv(
        './predictions/benchmark_decisions_4_hr_scan.csv', index=False)

else:
    # Load previous results
    results_30_4_hr_scan = pd.read_csv(
        './predictions/benchmark_decisions_4_hr_scan.csv')
results_30_4_hr_scan.head()
| Hospital | True | Majority | VKKDD9172T | TPXYE0168D | CNBGF2713O | NTPQZ0829K | GKONI0110I | HPWIF9956L | MHMYL4920B | ... | OHGIK1804X | UWCEW6851O | VZOCK3505U | TPFFP4410O | NGKDE7265L | LZGVG8257A | VKHPY9501A | GWOXR9160G | QZMCK3259S | OFKDF3720W | |
|---|---|---|---|---|---|---|---|---|---|---|---|---|---|---|---|---|---|---|---|---|---|
| 0 | FLVXS2956M | 1 | 1 | 1 | 1 | 1 | 1 | 1 | 1 | 1 | ... | 1 | 1 | 1 | 1 | 1 | 1 | 1 | 1 | 1 | 1 |
| 1 | FLVXS2956M | 0 | 0 | 0 | 0 | 0 | 0 | 0 | 0 | 0 | ... | 0 | 0 | 0 | 0 | 0 | 0 | 0 | 0 | 0 | 0 |
| 2 | FLVXS2956M | 1 | 1 | 1 | 1 | 1 | 1 | 1 | 1 | 1 | ... | 1 | 1 | 1 | 1 | 1 | 1 | 1 | 1 | 1 | 1 |
| 3 | FLVXS2956M | 0 | 0 | 0 | 0 | 0 | 0 | 0 | 0 | 0 | ... | 0 | 0 | 0 | 0 | 0 | 0 | 0 | 0 | 0 | 0 |
| 4 | FLVXS2956M | 0 | 0 | 0 | 1 | 1 | 1 | 1 | 1 | 0 | ... | 1 | 0 | 1 | 0 | 0 | 0 | 1 | 0 | 1 | 0 |
5 rows × 33 columns
Create summary pivot table#
df_pivot = results_30[['Hospital', 'True', 'Majority']].groupby('Hospital')
all_4hr_arrivals = df_pivot.sum() / df_pivot.count()
all_4hr_arrivals['count'] = df_pivot.count()['True']
df_pivot = results_30_4_hr_scan[['Hospital', 'True', 'Majority']].groupby('Hospital')
scan_4hrs_pivot = df_pivot.sum() / df_pivot.count()
scan_4hrs_pivot['count'] = df_pivot.count()['True']
hospital_benchmark_rates = pd.DataFrame()
hospital_benchmark_rates['count_4hr_arrival'] = all_4hr_arrivals['count']
hospital_benchmark_rates['actual_4hr_arrival'] = all_4hr_arrivals['True']
hospital_benchmark_rates['benchmark_4hr_arrival'] = all_4hr_arrivals['Majority']
hospital_benchmark_rates['count_4hr_scan'] = scan_4hrs_pivot['count']
hospital_benchmark_rates['actual_4hr_scan'] = scan_4hrs_pivot['True']
hospital_benchmark_rates['benchmark_4hr_scan'] = scan_4hrs_pivot['Majority']

# Add in whether hospital is in benchmark
benchmark_list = hospital_compare.set_index('hospital')
hospital_benchmark_rates= pd.concat([hospital_benchmark_rates, benchmark_list['benchmark']],axis=1)

hospital_benchmark_rates.to_csv('predictions/hospital_benchmark_rates.csv')
hospital_benchmark_rates
| count_4hr_arrival | actual_4hr_arrival | benchmark_4hr_arrival | count_4hr_scan | actual_4hr_scan | benchmark_4hr_scan | benchmark | |
|---|---|---|---|---|---|---|---|
| AGNOF1041H | 773 | 0.351876 | 0.479948 | 700 | 0.387143 | 0.527143 | False |
| AKCGO9726K | 1268 | 0.369874 | 0.350158 | 1106 | 0.416817 | 0.399638 | True |
| AOBTM3098N | 520 | 0.219231 | 0.326923 | 414 | 0.265700 | 0.398551 | False |
| APXEE8191H | 509 | 0.225933 | 0.286837 | 448 | 0.256696 | 0.323661 | False |
| ATDID5461S | 278 | 0.241007 | 0.262590 | 211 | 0.317536 | 0.345972 | False |
| ... | ... | ... | ... | ... | ... | ... | ... |
| YPKYH1768F | 281 | 0.245552 | 0.352313 | 224 | 0.308036 | 0.441964 | False |
| YQMZV4284N | 418 | 0.236842 | 0.272727 | 319 | 0.310345 | 0.351097 | False |
| ZBVSO0975W | 384 | 0.250000 | 0.406250 | 350 | 0.274286 | 0.442857 | False |
| ZHCLE1578P | 1043 | 0.223394 | 0.267498 | 882 | 0.263039 | 0.312925 | False |
| ZRRCV7012C | 626 | 0.158147 | 0.297125 | 523 | 0.189293 | 0.347992 | False |
132 rows × 7 columns
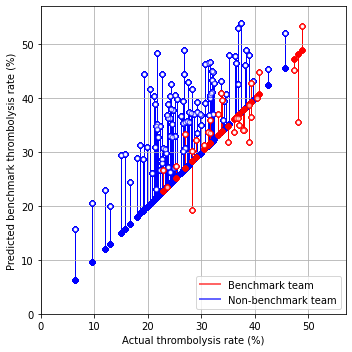
fig = plt.figure(figsize=(5,5))
ax = fig.add_subplot()

# Plot non-benchmark hospitals in blue
mask = hospital_benchmark_rates['benchmark'] == False
non_bench = hospital_benchmark_rates[mask]

for i, val in non_bench.iterrows():
    start = [non_bench['actual_4hr_arrival'] * 100,
             non_bench['actual_4hr_arrival'] * 100]
    end = [non_bench['actual_4hr_arrival'] * 100,
             non_bench['benchmark_4hr_arrival'] * 100]
    ax.plot(start, end, c='b', lw=1, zorder=1)
    ax.scatter(start[0], start[1], marker='o', facecolors='b', edgecolors='b',
               s=20, zorder=2, alpha=0.6)
    ax.scatter(end[0], end[1], marker='o', facecolors='w', edgecolors='b',
               s=20, zorder=2, alpha=0.6)

# Plot benchmark hospitals in red
mask = hospital_benchmark_rates['benchmark']
bench = hospital_benchmark_rates[mask]

for i, val in bench.iterrows():
    start = [bench['actual_4hr_arrival'] * 100,
             bench['actual_4hr_arrival'] * 100]
    end = [bench['actual_4hr_arrival'] * 100,
             bench['benchmark_4hr_arrival'] * 100]
    ax.plot(start, end, c='r', lw=1, zorder=1)
    ax.scatter(start[0], start[1], marker='o', facecolors='r', edgecolors='r',
               s=20, zorder=2, alpha=0.6)
    ax.scatter(end[0], end[1], marker='o', facecolors='w', edgecolors='r',
               s=20, zorder=2, alpha=0.6)


# Add mods
ax.set_xlabel('Actual thrombolysis rate (%)')
ax.set_ylabel('Predicted benchmark thrombolysis rate (%)')
ax.set_xlim(0, 57)
ax.set_ylim(0, 57)
ax.grid()

custom_lines = [Line2D([0], [0], color='r', alpha=0.6, lw=2),
                Line2D([0], [0], color='b', alpha = 0.6,lw=2)]

plt.legend(custom_lines, ['Benchmark team', 'Non-benchmark team'],
          loc='lower right')

plt.tight_layout()
plt.savefig('output/benchmark_thrombolysis.jpg', dpi=300)

plt.show()
Calculated weighted average#
Weight thrombolysis by admission numbers
base_4hr_arrival = ((hospital_benchmark_rates['count_4hr_arrival'] *
                     hospital_benchmark_rates['actual_4hr_arrival']).sum() /
                    hospital_benchmark_rates['count_4hr_arrival'].sum())

benchmark_4hr_arrival = ((hospital_benchmark_rates['count_4hr_arrival'] *
                     hospital_benchmark_rates['benchmark_4hr_arrival']).sum() /
                    hospital_benchmark_rates['count_4hr_arrival'].sum())

base_4hr_scan = ((hospital_benchmark_rates['count_4hr_scan'] *
                     hospital_benchmark_rates['actual_4hr_scan']).sum() /
                    hospital_benchmark_rates['count_4hr_scan'].sum())

benchmark_4hr_scan = ((hospital_benchmark_rates['count_4hr_scan'] *
                     hospital_benchmark_rates['benchmark_4hr_scan']).sum() /
                    hospital_benchmark_rates['count_4hr_scan'].sum())
print (f'Baseline thrombolysis onset-to-arrival of 4 hrs: {base_4hr_arrival*100:0.1f}')
print (f'Benchmark thrombolysis onset-to-arrival of 4 hrs: {benchmark_4hr_arrival*100:0.1f}')
ratio = benchmark_4hr_arrival / base_4hr_arrival
print (f'Benchmark thrombolysis ratio onset-to-arrival of 4 hrs: {ratio:0.3f}')
print ()
print (f'Baseline thrombolysis onset-to-scan of 4 hrs: {base_4hr_scan*100:0.1f}')
print (f'Benchmark thrombolysis onset-to-scan of 4 hrs: {benchmark_4hr_scan*100:0.1f}')
ratio = benchmark_4hr_scan / base_4hr_scan
print (f'Benchmark thrombolysis ratio onset-to-scan of 4 hrs: {ratio:0.3f}')
Baseline thrombolysis onset-to-arrival of 4 hrs: 29.5
Benchmark thrombolysis onset-to-arrival of 4 hrs: 36.9
Benchmark thrombolysis ratio onset-to-arrival of 4 hrs: 1.251

Baseline thrombolysis onset-to-scan of 4 hrs: 35.0
Benchmark thrombolysis onset-to-scan of 4 hrs: 43.8
Benchmark thrombolysis ratio onset-to-scan of 4 hrs: 1.250
Observations#
A ‘benchmark’ set of hospitals was created by identifying those 30 hospitals with the highest predicted thrombolysis use in a set cohort of patients.
The benchmark hospitals were not necessarily the top thrombolysing hospitals given their own patient populations.
If decision to treat were made according to a majority vote of the benchmark set of hospitals then thrombolysis use (in those arriving within 4 hours of known stroke onset) would be expected to increase from 29.5% to 36.9%.